

以太坊K线分析,变现机会分享,V神动态跟踪,以太坊链上追踪等👏
Topic Background

Crypto Zhong Liang
Crypto Newbie
37m ago
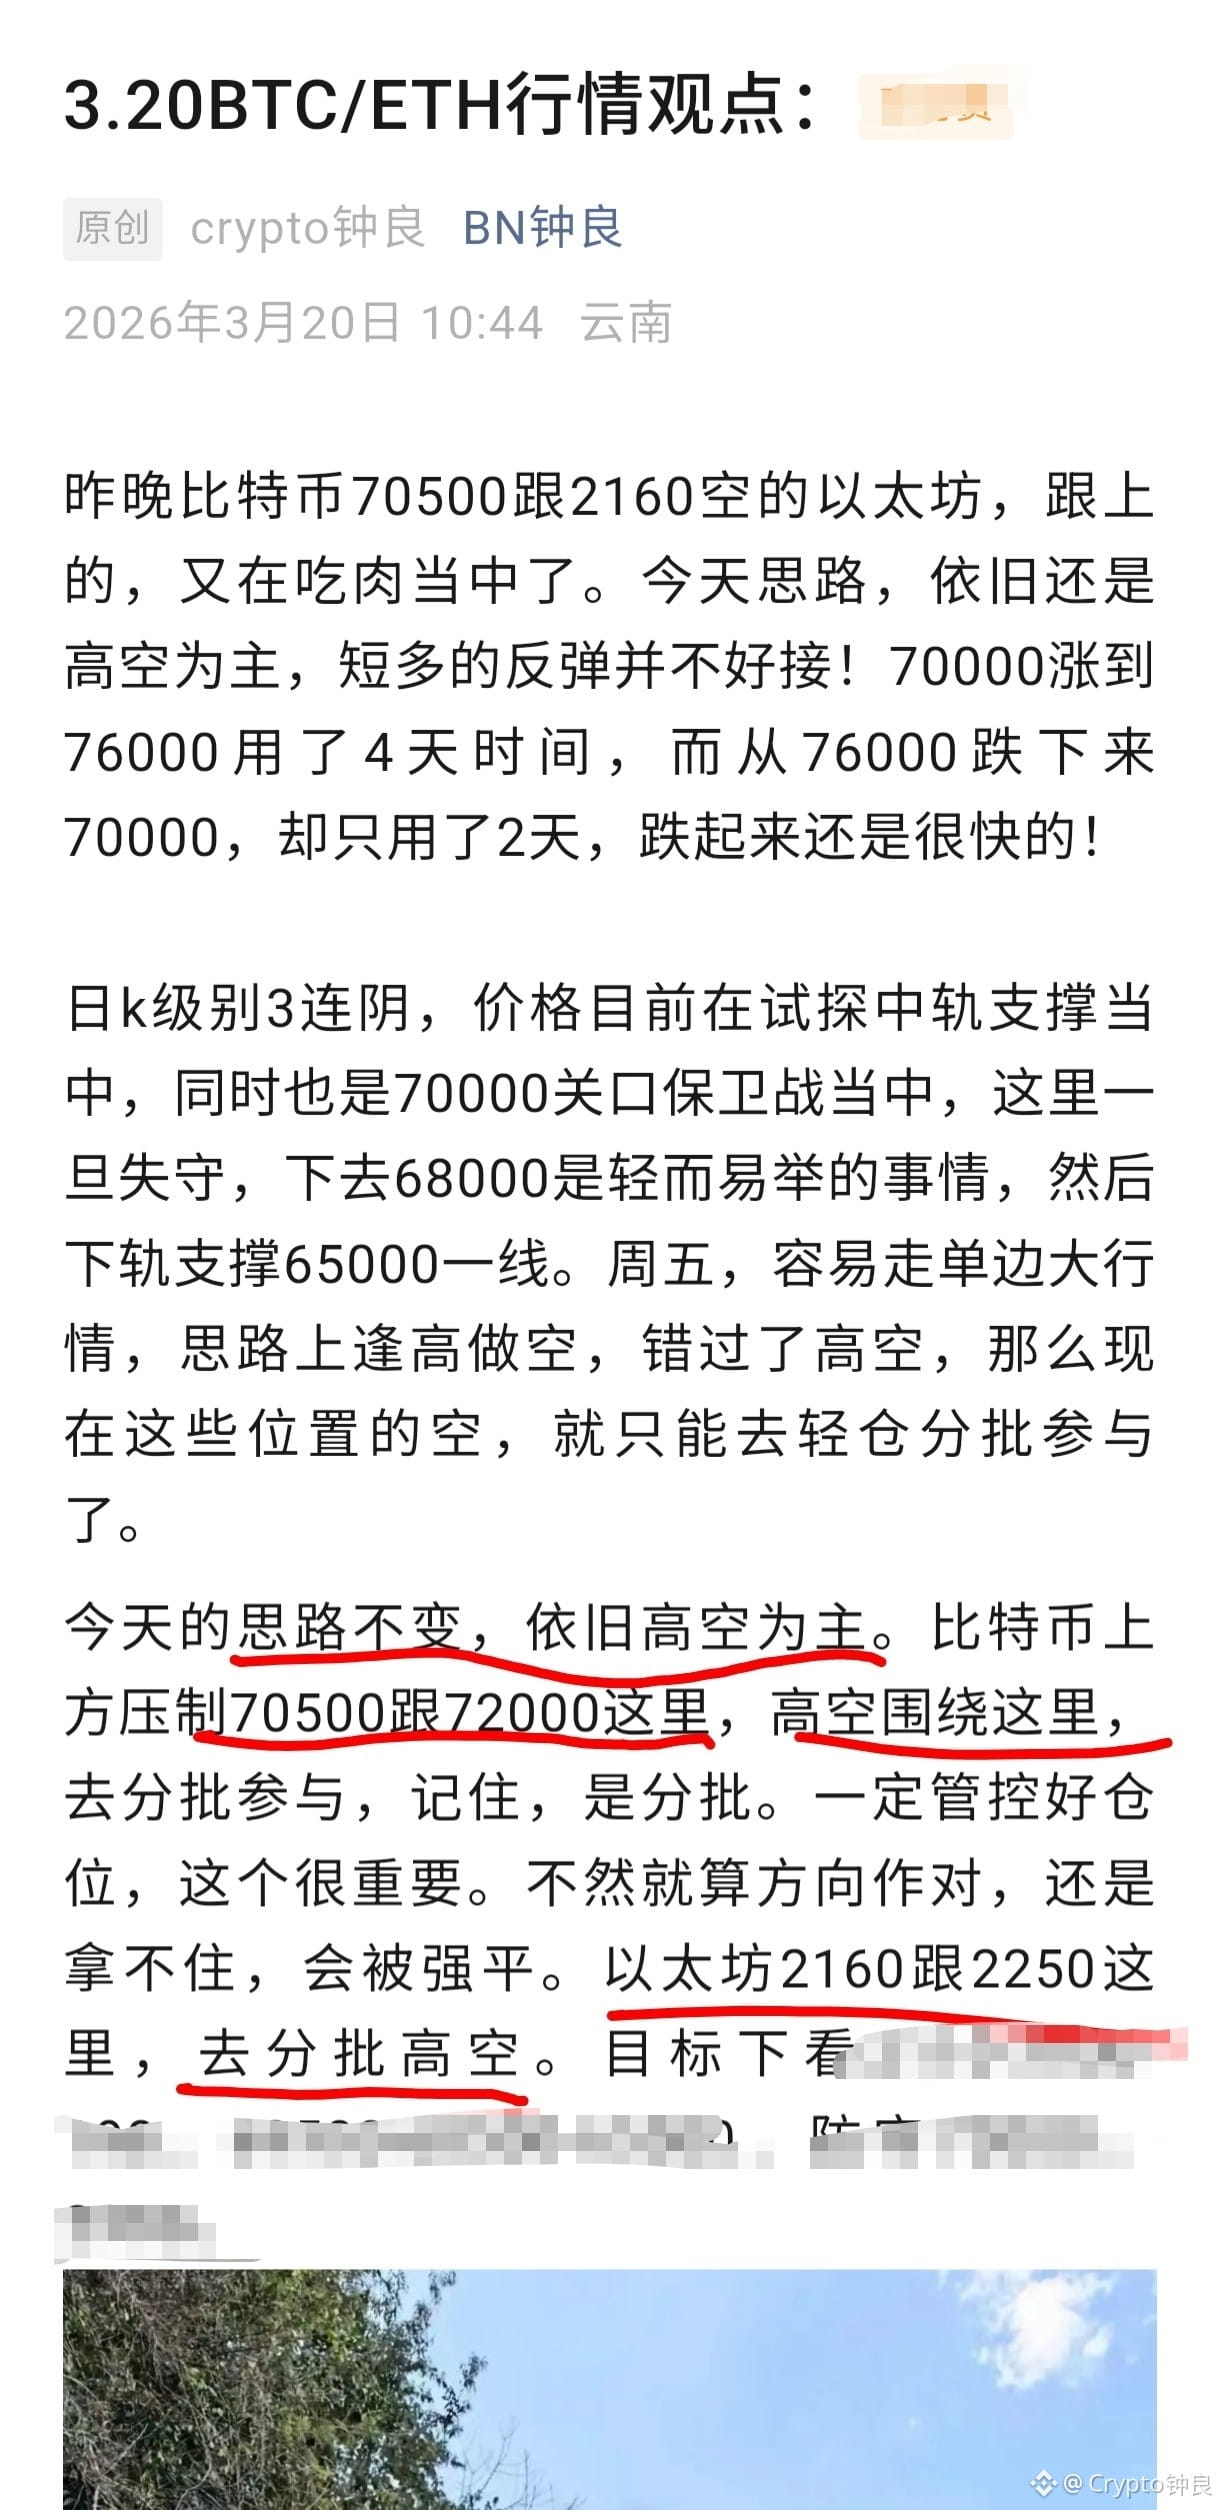
3.23 BTC/ETH Market Outlook:
Geopolitical factors caused gold to plummet at the opening on Monday. It's said that when cannons roar, gold soars; this time, oil prices took off, causing gold to fall. Bitcoin also continued its downward trend. Last Friday, we publicly recommended shorting at 70500 and Ethereum at 2160, which we successfully guided everyone to 68000 and 65000 respectively – everyone profited! If you missed out, don't worry, there are opportunities every day. As long as the direction is right, you'll eventually get on board and make money!
Bitcoin's weekly chart closed with a large inverted hammer candlestick, ending the previous two-week winning streak. The price broke below 68000. All three Bollinger Bands are widening downwards, with the lower band flattening out and opening lower again, indicating further downside potential. The MACD is still showing increasing bearish momentum. On the daily chart, the price rebounded to around 76,000 before encountering resistance and retracing, breaking through the middle Bollinger Band support. The lower Bollinger Band is widening downwards, creating room for further decline. The KDJ and RSI indicators, after being overbought at high levels, formed a death cross and continued to decline. The MACD bearish momentum continues to increase.
On the short-term 4-hour chart, the price continues to decline, pressured by the lower Bollinger Band, repeatedly testing it with false breakouts. The KDJ and RSI indicators are oversold at low levels and show signs of turning upwards, suggesting a need for a rebound correction. Avoid being overly aggressive in shorting. The MACD bearish momentum continues to increase. On the hourly chart, all three Bollinger Bands are widening downwards, with the price consistently pressured by the middle band, forcing the lower band to widen further downwards. The intraday strategy is primarily shorting on rallies.
Those holding short positions from last week at 70,500 can continue to hold, watching the 65,000 support level. Those without short positions should patiently wait for a rebound to allow the indicators to correct slightly before entering short positions; this will be a more prudent approach. More details are omitted here. The intraday short-selling plan has been arranged; the rest is up to time! $BTC #Gold suffers its biggest weekly drop in 43 years


26

435

31


Wu Blockchain
Binance
45m ago
According to data from SoSoValue, Bitcoin spot ETFs saw a net inflow of $95.18 million last week (March 16th to March 20th, Eastern Time), marking the fourth consecutive week of net inflows. Ethereum spot ETFs experienced a net outflow of $59.94 million. SOL spot ETFs saw a net inflow of $21.1 million. XRP spot ETFs saw a net inflow of $640,000.
25
300
39


Encrypted boring mouth
Crypto Newbie
1h ago
$BTC $ETH $BNB
Global Crisis!
48-Hour Deadline: Oil Lifeline at Risk
On March 23, the Middle East situation completely exploded. Trump issued a 48-hour ultimatum to Iran, demanding the unconditional opening of the Strait of Hormuz, threatening to bomb key Iranian facilities such as power plants if Iran refused.
Iran responded directly, stating that if any attack was launched, the Strait of Hormuz would be completely blocked, and the scope of attacks would be expanded to include energy, technology, and desalination facilities.
The conflict has now lasted four weeks, disrupting one-fifth of global oil and gas transportation. Oil prices have skyrocketed, and the market is worried that supply chain disruptions will drive up inflation, dragging down the global economy. Geopolitical risks are escalating.
#TrumpConsidersEndingIranConflict #TrendingTopic
26
408
49

How can you know my joy?
Crypto Newbie
2h ago
#ETH
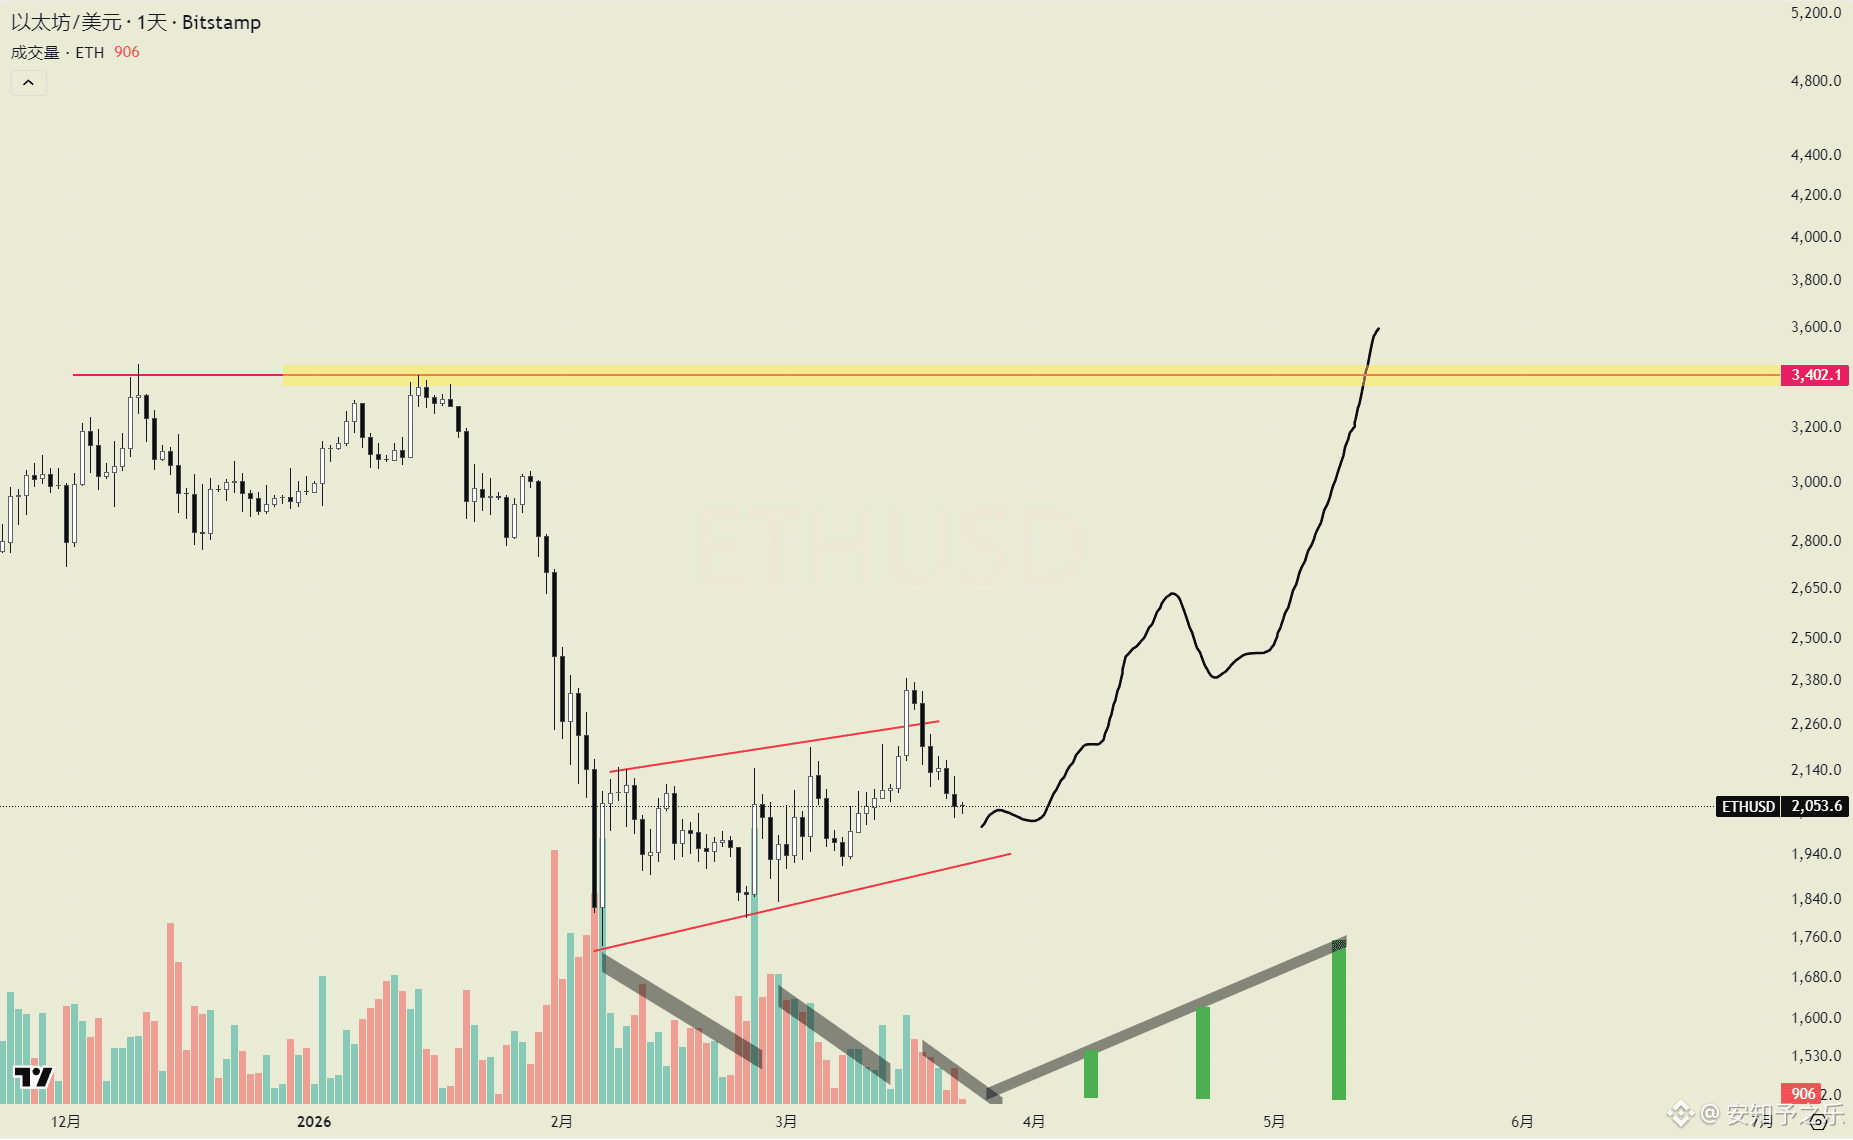
I reviewed the chart again, and my conclusion remains the same: I believe there's only one answer.
Surface Analysis:
The short-term candlestick pattern (from 1750 to now) is very standard, a standard upward-sloping flag pattern in a bear market, complete with a false breakout. This structure is generally a precursor to a downward plunge.
This is the most direct and "easy-to-understand" signal the chart is currently providing, very similar to BTC's movement from May to June 2022.
But the question is, is it really that simple?
On the surface, it does look very similar, like the four-year cycle everyone has always believed in, which seems to have remained unchanged. But do you remember when BTC reached 120,000? Back then, the entire market was predicting 150,000 because, according to past cycles, October, November, and December are typically the main upward phase.
And this time? October, November, and December saw a continuous decline.
See? That's how the market works; if you're even a step behind, you can easily fall into a trap.
Essential Analysis:
So what I've been doing is trying to be one step ahead of the market. I generally don't just look at surface patterns, nor do I rigidly apply historical data (otherwise, I wouldn't have been able to go from a bearish outlook of 4900 to 1800).
In my view, the current situation is more like a preparatory phase before an upward move. From BTC at 60,000 and ETH at 1750 to now, several points are crucial:
① Compared to the previous consolidation range (December 2025 - January 2026), trading volume has significantly increased, which is quite unusual—the market is clearly more bearish, but liquidity is actually increasing.
② Even stranger, if you look closely, you'll find that demand is consistently present, but supply hasn't kept up significantly. This situation shouldn't be occurring at this stage.
③ And then there are the "bull market trap logic" I've repeatedly mentioned before (I won't elaborate here).
When you stop focusing on these candlestick patterns and stop comparing them to historical data,
you'll find that what the market is really brewing right now is only one thing: an upward trend.
27
428
26


Liu Duoyu in silence
Crypto Newbie
2h ago
A year ago, everyone thought Trump, being a businessman, wouldn't start wars around the world, just like before. Six months ago, everyone thought he would perform well in the midterm elections to maintain the stock market boom and avoid trouble.
Now, Trump is using everyone's money to wage wars everywhere, and Bitcoin is experiencing its worst performance in nearly a decade. 😂
$BTC $ETH $LDO
{spot}(LDOUSDT)
{spot}(ETHUSDT)
{spot}(BTCUSDT)
21
491
34