

聚焦特朗普在加密货币领域的公开态度、政策倾向及其对市场情绪、监管预期与行业发展的潜在影响,帮助你快速理解政治变量对加密市场的作用。
Topic Background

Chain Research Institute | AI First 🔸💧
Crypto Newbie
1h ago
Trump's Three Black Magic Rules:
1. Never admit you're wrong.
2. Never give up, even if you lose.
3. Even if you're truly wrong, fight back against those who attack you.
In the battlefield of power, controlling the narrative is far more important than possessing the truth.
Some have summarized it even more succinctly: sophistry + shamelessness + keep going.


49

354

37


CryptoMubai
Crypto Newbie
2h ago
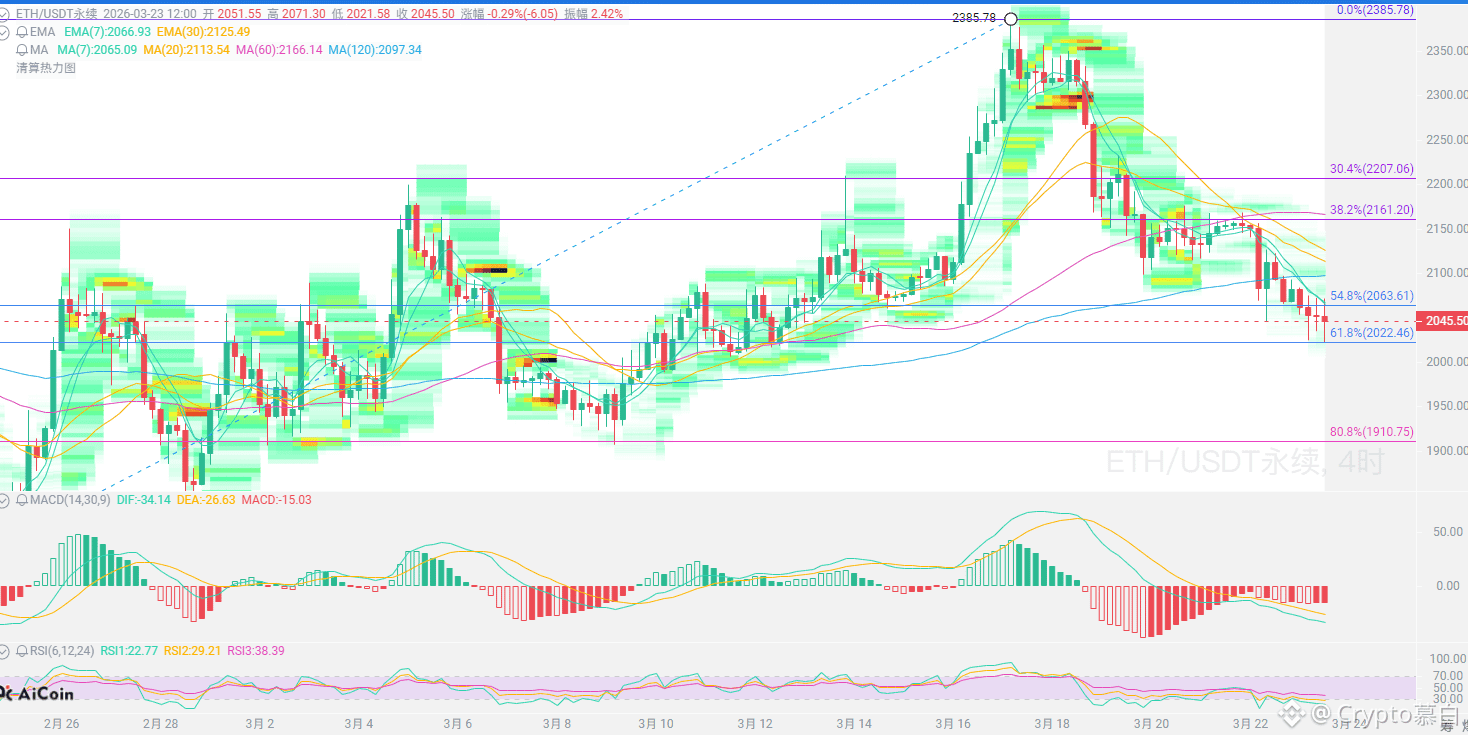
Let's analyze the trend of $ETH today:
From the daily chart, it broke below the Bollinger Band middle line at 2093, with the lower Bollinger Band around 1890, meaning there's still room for further decline. The daily MACD histogram turned green but continues to expand, and the RSI has fallen below 50, indicating that the bullish momentum has been exhausted, and the bears are now in control.
On the 4-hour chart, the price broke below the EMA, short-term moving averages are in a bearish alignment, the price is being suppressed by the Bollinger Band middle line, the MACD histogram continues to expand, and the RSI is around 45, indicating that bearish momentum is still being released, and the weak downward trend is clear.
ETH is currently in a weak pattern of "major players running away, retail investors buying," with the daily and 4-hour charts showing bears in control. 2000 is a key support level. If it holds, there might be a rebound to 2100-2120; if it fails to hold, the next target is 1900-1800. The trend remains bearish, and any rebound is an opportunity to sell!
Short-term resistance: 2100-2120
Short-term support: 2000-1980
ETH is currently in a medium-to-long-term downtrend channel, with short-term range-bound trading and weak rebounds!
#CZ says Bitcoin is a hard asset #Trump's 48-hour ultimatum
{future}(ETHUSDT)
43
437
49

JIM'S FRIENDS
Crypto Newbie
2h ago
Previously, when only the Shanghai Stock Exchange was available, it was inconvenient for people to deposit their assets. To avoid this inconvenience, Trump opened up global channels for this purpose.
The American Stock Exchange, the Korean Stock Exchange, the Japanese Stock Exchange, cryptocurrency exchanges—various Shanghai Stock Exchange chains have sprung up, seemingly to ensure people have a place to deposit their assets!

45
333
35
CryptoMubai
Crypto Newbie
3h ago
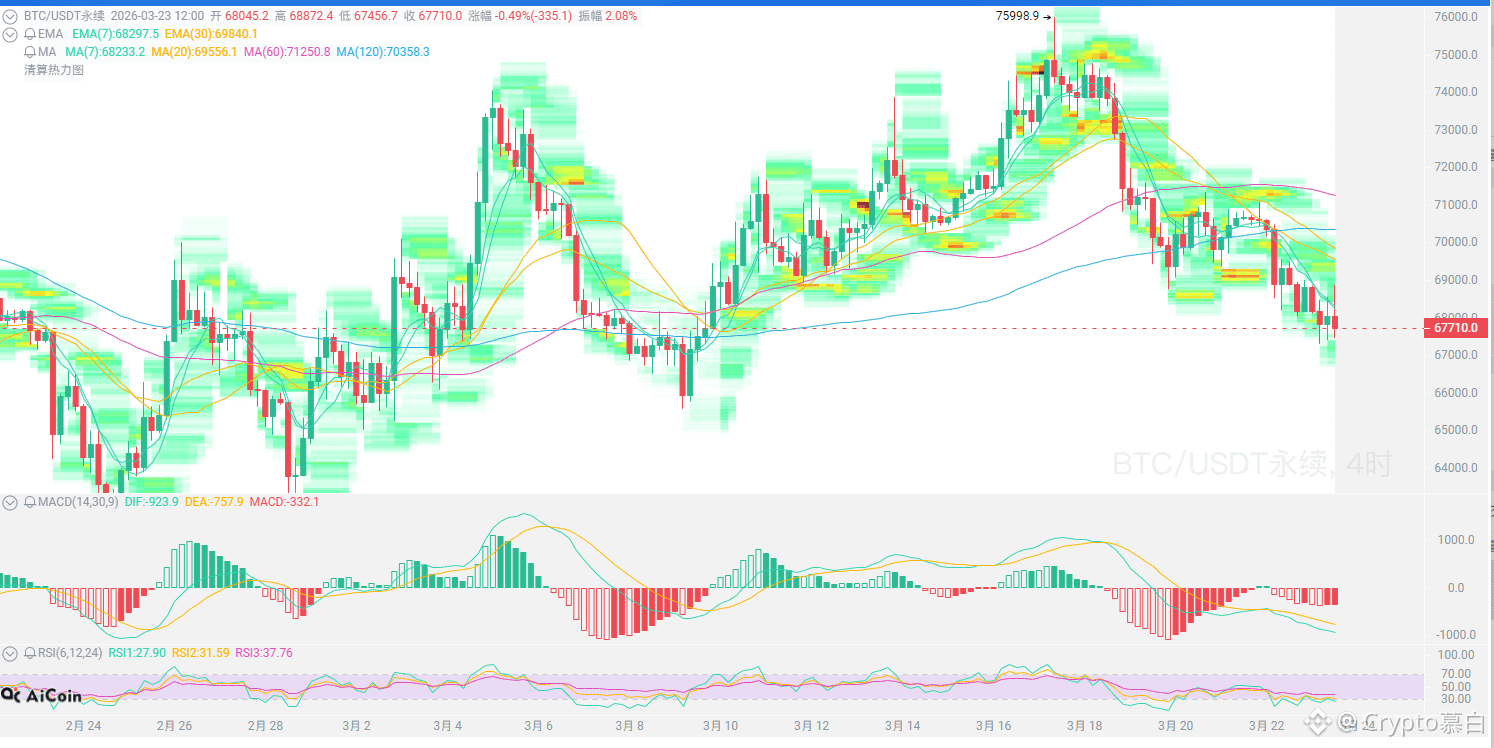
Let's analyze today's $BTC trend:
From a candlestick chart perspective, the price has been suppressed below the moving average for several days, breaking below the 20-day moving average and the Bollinger Band middle line, indicating a weak short-term trend.
The bears are still in control, but momentum is weakening. The MACD histogram shows that the downward momentum is weaker than in previous days, indicating that although the price is still falling, the selling pressure is not as strong as before.
The RSI is around 46, not yet in the oversold zone, suggesting there may be further downside potential.
On the hourly chart, the price is being suppressed by a descending trendline, with resistance around 69200. If it cannot break above this level, the rebound will be limited.
The Fear & Greed Index has fallen to around 10, indicating extreme fear, suggesting that retail investors are panicked. Interestingly, institutions seem to have stayed—data shows that Bitcoin ETFs saw a net inflow of $1.3 billion in March, and whales have cumulatively bought over 40,000 BT.
Retail investors are selling at a loss, while institutions are accumulating shares. This contrarian signal historically often indicates that the market is nearing its bottom.
Upside resistance: 69000-70000
Downside support: 67000-66000
Short-term trend is slightly weak and volatile, like being pulled back and forth within a "range," lacking a clear direction. The overall structure remains bearish. Institutions are quietly accumulating, but retail investor confidence is weak, making further declines possible! Be aware of the risks.
#CZ says Bitcoin is a hard asset #Trump's 48-hour ultimatum
{future}(BTCUSDT)
23
405
45

Finance Wukong Pro
Crypto Newbie
3h ago
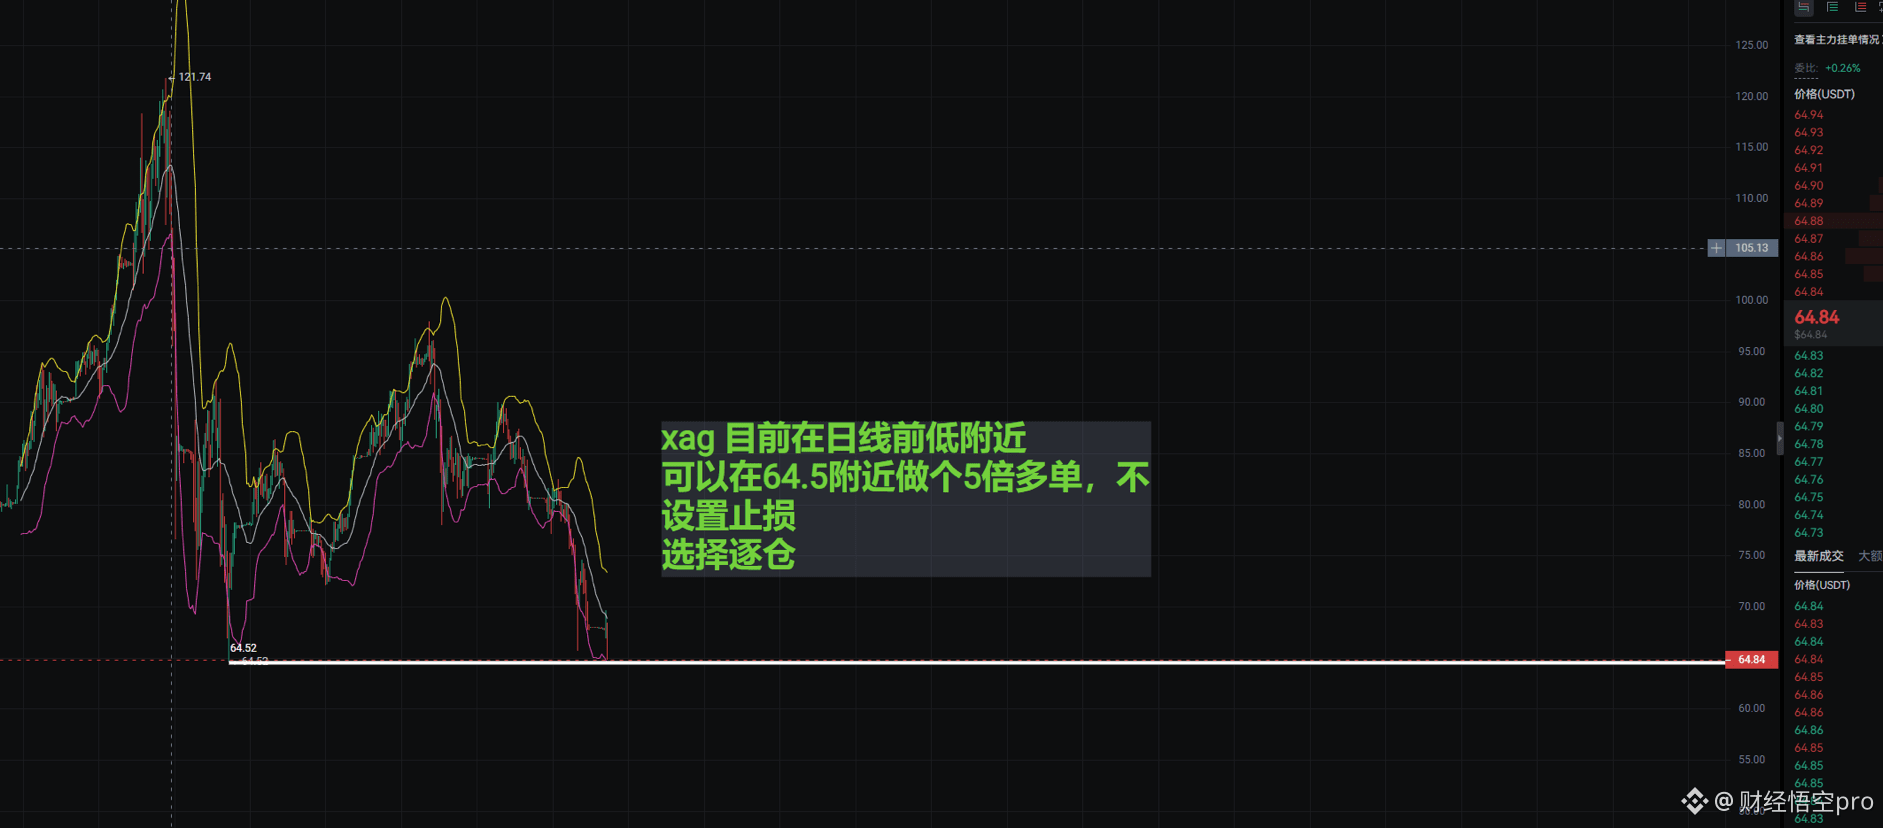
XAG is currently near its previous low on the daily chart. A long position of 5x leverage could be initiated around 64.5, without setting a stop-loss, using isolated margin. #GoldPostsLargestWeeklyDropIn43Years #TrumpConsidesEndingIranConflict #iOSSecurityUpdate $BTC
30
303
23

Mars Finance
Crypto Newbie
4h ago
🔔“Federal Reserve Mouthpiece”: Rising Energy Prices Exacerbate Fed Transition Dilemma, Warsh Faces Dilemma
According to Mars Finance, citing Jinshi Data, Nick Timiraos, often referred to as the “Federal Reserve mouthpiece,” stated that soaring energy prices have made the already complex transition of power at the Federal Reserve even more difficult.
This process was already quite complicated. Kevin Warsh’s appointment stalled due to an investigation by the Department of Justice and obstruction from Tillis. Furthermore, unlike previous Fed chairs since Volcker, Warsh pledged a complete break with his predecessors, rather than continuing their policies.
Currently, the market expects a 50/50 chance of interest rate hikes and cuts this year, potentially putting Warsh in a dilemma: on one hand, nominating his president, and on the other hand, the committee he will lead.
In 2008, after a period of aggressive interest rate cuts, oil prices suddenly surged. At that time, Warsh strongly argued that inflation risk was “the main risk” and suggested that the Fed’s next move should be an interest rate hike. Trump, however, expected the opposite.

44
326
30

Yuyue
Crypto Newbie
4h ago
The weekend news had a tense, simmering atmosphere. Crude oil opened slightly higher but then fell, and the Nasdaq opened lower and then plummeted. Overall, I'm not optimistic about today's US stock market performance.
The situation remains tense. Iran's land forces are poised for action. Regarding Trump's statement that "the US has wiped Iran off the map," a group member commented: "If you didn't know better, you'd think he was playing Civilization 6..."

22
433
32


Encrypted boring mouth
Crypto Newbie
6h ago
$BTC $ETH $BNB
Global Crisis!
48-Hour Deadline: Oil Lifeline at Risk
On March 23, the Middle East situation completely exploded. Trump issued a 48-hour ultimatum to Iran, demanding the unconditional opening of the Strait of Hormuz, threatening to bomb key Iranian facilities such as power plants if Iran refused.
Iran responded directly, stating that if any attack was launched, the Strait of Hormuz would be completely blocked, and the scope of attacks would be expanded to include energy, technology, and desalination facilities.
The conflict has now lasted four weeks, disrupting one-fifth of global oil and gas transportation. Oil prices have skyrocketed, and the market is worried that supply chain disruptions will drive up inflation, dragging down the global economy. Geopolitical risks are escalating.
#TrumpConsidersEndingIranConflict #TrendingTopic
26
409
49