

有关比特币的一切你都可以在这里发现,比特币视频解说,文字解说,比特币相关价格、技术、底层原理、未来发展统统覆盖到✌
Topic Background


ChandlerGuo Guo Hongcai Bao Erye
Crypto Newbie
6m ago
🚨Breaking News: Hong Kong-based "MicroStrategy" Plans to Purchase $70 Million in Cryptocurrency
Hong Kong-based "MicroStrategy"—Boyaa Interactive—plans to use idle funds to purchase $70 million worth of cryptocurrency. The company will seek shareholder approval for the purchase.
This $70 million investment may be available within the next 12 months. The funds will come from the company's idle cash reserves.
The company currently holds 4,092 Bitcoins (BTC), 302 Ethereum (ETH), and approximately 7 million USDT.


47

346

48


CryptoMubai
Crypto Newbie
18m ago
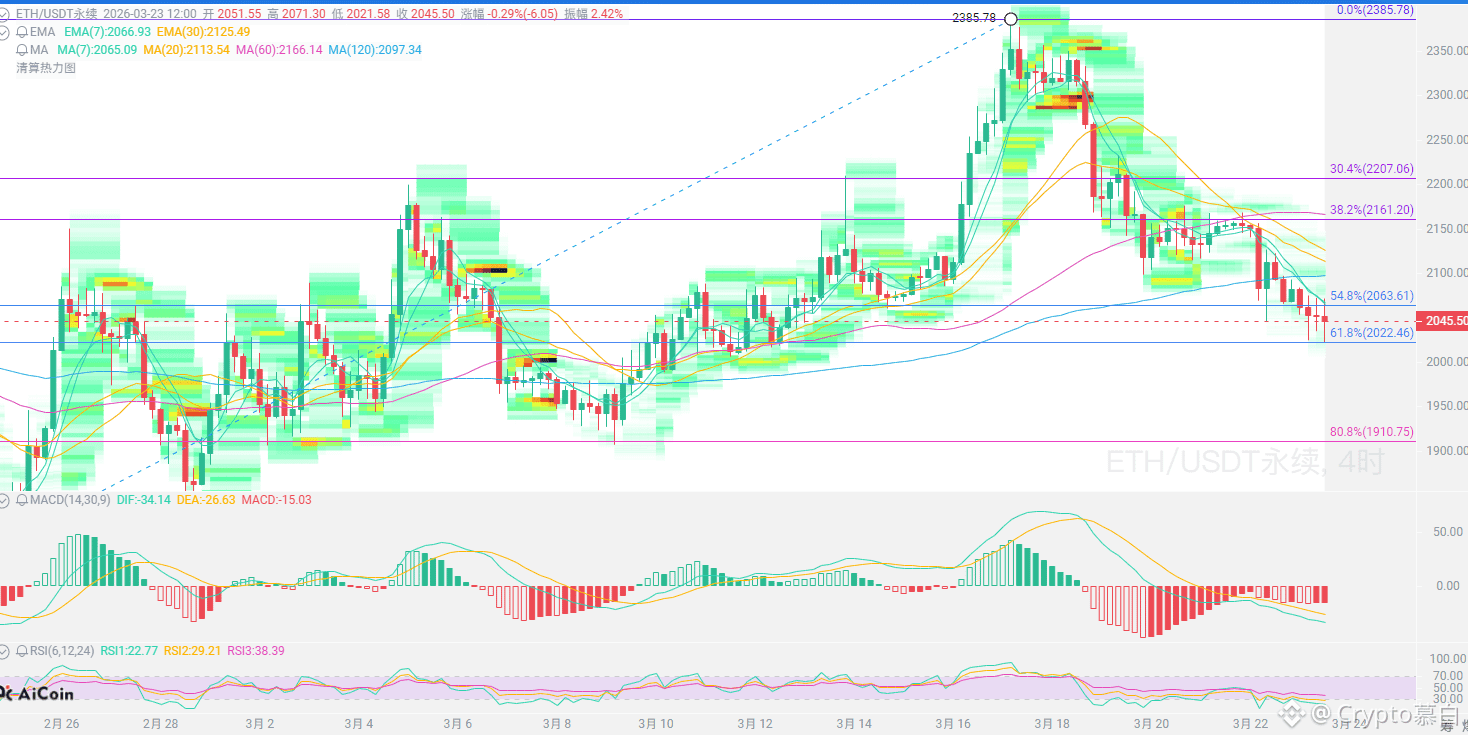
Let's analyze the trend of $ETH today:
From the daily chart, it broke below the Bollinger Band middle line at 2093, with the lower Bollinger Band around 1890, meaning there's still room for further decline. The daily MACD histogram turned green but continues to expand, and the RSI has fallen below 50, indicating that the bullish momentum has been exhausted, and the bears are now in control.
On the 4-hour chart, the price broke below the EMA, short-term moving averages are in a bearish alignment, the price is being suppressed by the Bollinger Band middle line, the MACD histogram continues to expand, and the RSI is around 45, indicating that bearish momentum is still being released, and the weak downward trend is clear.
ETH is currently in a weak pattern of "major players running away, retail investors buying," with the daily and 4-hour charts showing bears in control. 2000 is a key support level. If it holds, there might be a rebound to 2100-2120; if it fails to hold, the next target is 1900-1800. The trend remains bearish, and any rebound is an opportunity to sell!
Short-term resistance: 2100-2120
Short-term support: 2000-1980
ETH is currently in a medium-to-long-term downtrend channel, with short-term range-bound trading and weak rebounds!
#CZ says Bitcoin is a hard asset #Trump's 48-hour ultimatum
{future}(ETHUSDT)
43
436
49

Annie Lian
Crypto Newbie
19m ago
My personal analysis of Bitcoin price movements based on the Fibonacci sequence, Elliott Wave Theory, and global M2 supply:
1/ "Cooling Down" Phase (Now – April 2026)
The market has weakened after last year's significant surge. Prices are consolidating, trying to decide whether to continue rising or falling.
Key Price Level: Watch $74,000. If the price continues to fall below this level, the "cooling down" phase will continue.
Target: Find a bottom where buyers can safely enter.
2/ "Bottoming Down" Phase (May – July 2026)
Historically, this is a period of the largest "sell-off." A final wave of price declines is expected to clear out the remaining sellers.
Price Target: Prices could fall to $61,000, or even as low as $53,000.
Market Sentiment: This often feels like a "mini-winter," with headlines turning negative before the next major fluctuation.
3/ The "Recovery" Phase (August to December 2026)
If the summer bottom holds, the market will typically begin a slow and steady recovery.
Price Target: The target is to return to the $100,000 mark. If momentum is strong, prices could break through $130,000 by the end of this year or early 2027.
(Non-financial advice)
20
481
49


BATTLE
Crypto Newbie
34m ago
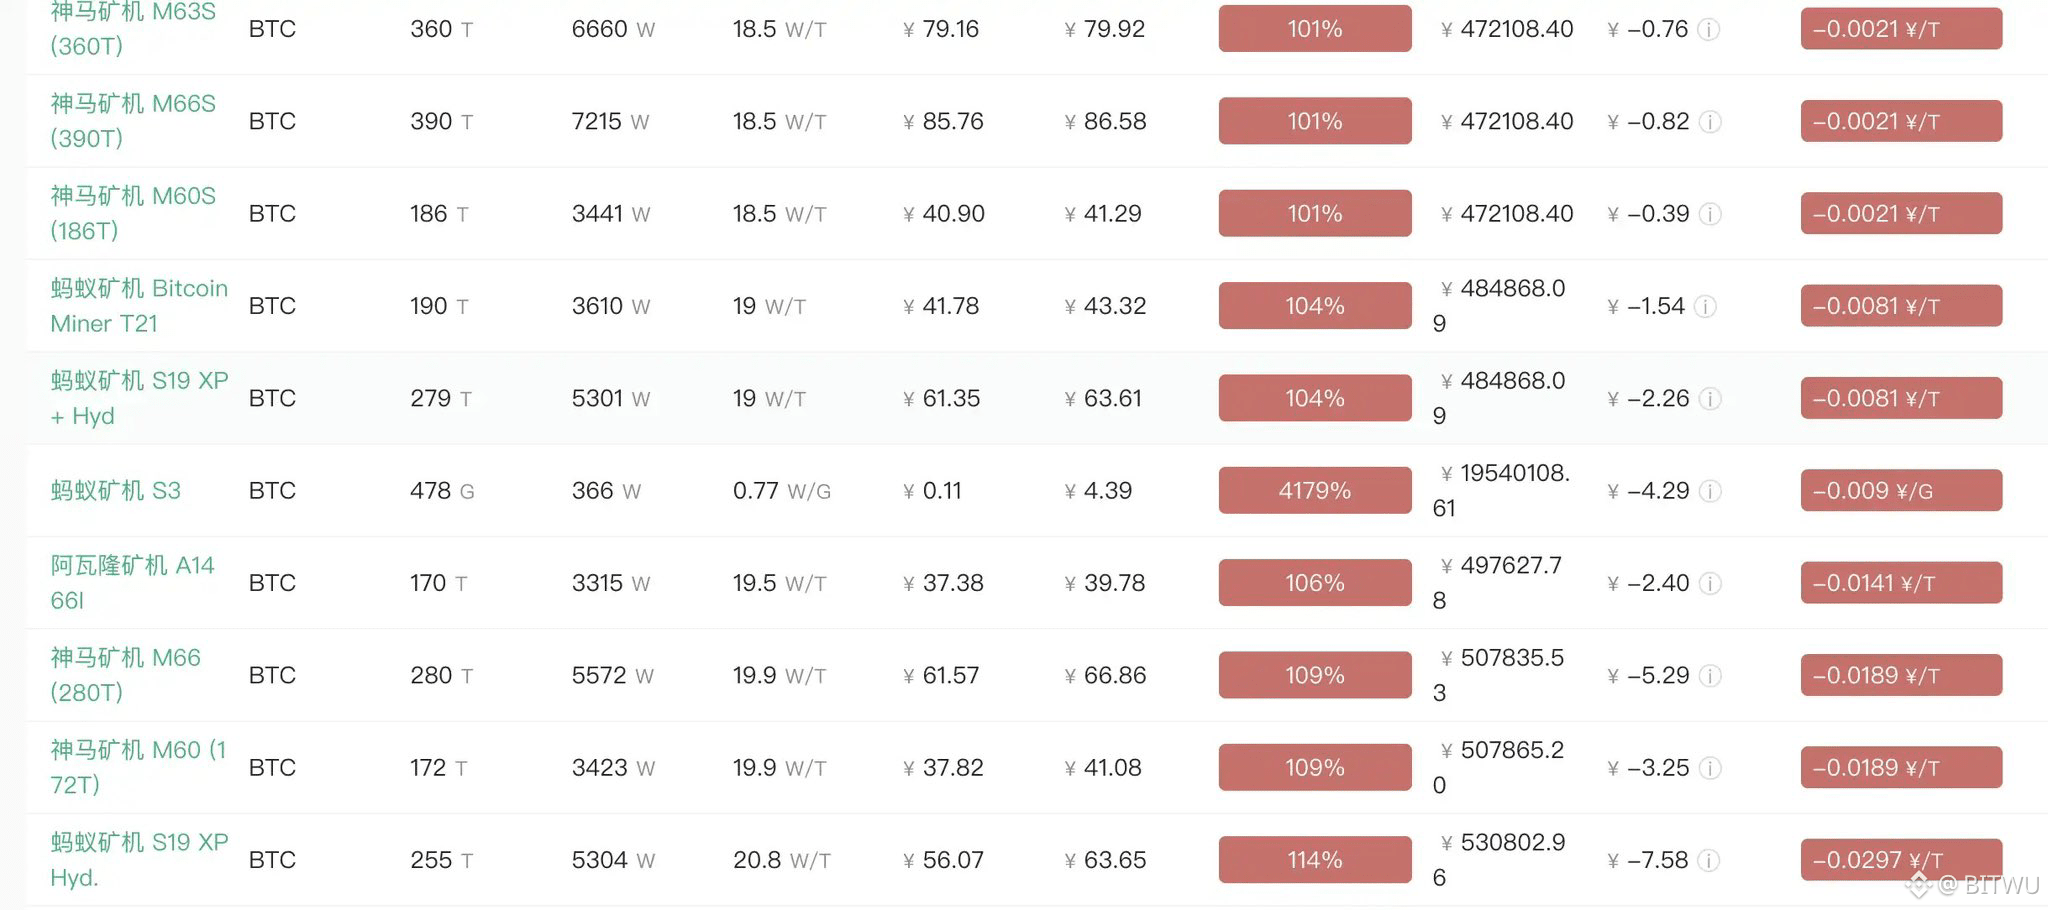
⚠️ Based on an electricity price of $0.08/kWh and a 5% mining pool fee, the mainstream Antminer S21 series has already reached its shutdown price.
Only some high-end new models are still profitable, with a shutdown price of $44,000.
2018: Bottom price $3,200, mainstream S9 shutdown price $4,000.
2022: Bottom price $15,000, mainstream S19 shutdown price $18,000.
So the question is, if we follow the old model—
Will the mainstream S21 shutdown price reach $69,000 in 2026, and will the bottom for $BTC in this round be $55,000?
49
302
27

Mr. Chunshui
Crypto Newbie
35m ago
I sold my gold on Zhuanzhuan (a gold trading platform) on March 11th, and then the price plummeted. There were three reasons I sold:
1. I saw a post from a fellow trader saying @BTC_Alert_ had taken profits at 5300, so I sold some too.
2. The crypto market has seen too much pullback; I wanted to keep some cash flow for living expenses. 🥹🥹, they were offering discounts per gram. Domestic platforms like Zhuanzhuan and Aihuishou have doubled their fees. 👀
When I sold, the domestic gold price was around 1170, and Zhuanzhuan charged me 20 yuan in fees. Aihuishou next door was even more expensive, charging 40 yuan. After checking both, I chose Zhuanzhuan. Now the gold price is 918, and my 40+ grams have lost over 10,000 yuan.
I remember before the Lunar New Year, Zhuanzhuan's fees were only 12 yuan, and Aihuishou's were 16 yuan. 👀
Keep your cash flow safe; this winter is going to be tough. 🥹🥹

43
458
21

xiyu
Crypto Newbie
53m ago
After accumulating a certain amount of Bitcoin, you should start dollar-cost averaging (DCA).
I know this sounds contradictory to many Bitcoin hoarders.
What's the purpose of hoarding? Ultimately, isn't it for a better life?
If you only buy and never sell, your quality of life won't improve, and your mindset will become increasingly tense.
You'll feel anxious when the market drops because all your money is locked up.
The benefits of DCA are: maintaining a suitable cash flow, a steady improvement in your quality of life, and a much better mindset. Because you know that no matter how the market moves, your life won't be bad.
A more advanced approach is to use the reverse of DCA logic—sell more at high prices and less or nothing at low prices.
Use sentiment indicators and price ranges as a strategy switch.
Would you consider DCA? Or do you feel you shouldn't sell any?
25
432
46
CryptoMubai
Crypto Newbie
57m ago
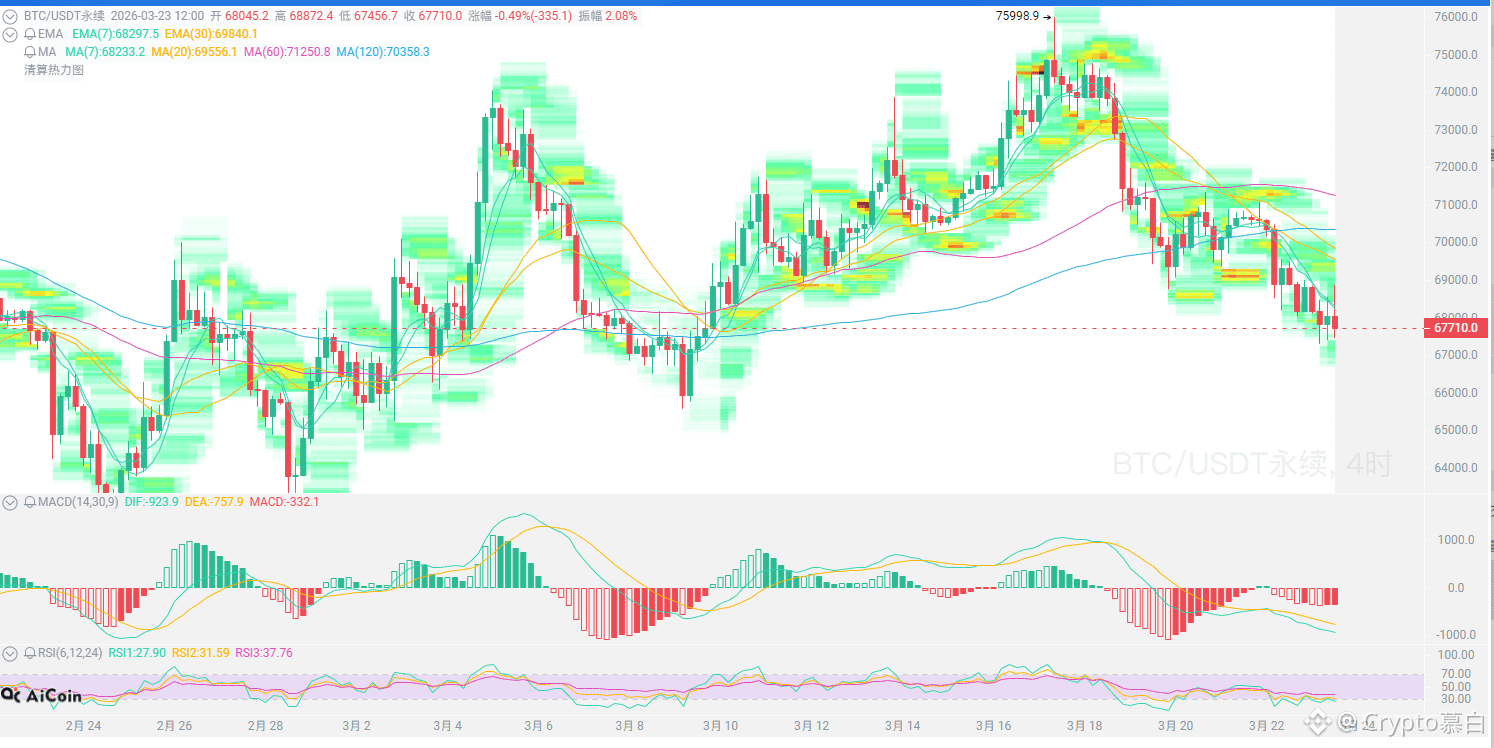
Let's analyze today's $BTC trend:
From a candlestick chart perspective, the price has been suppressed below the moving average for several days, breaking below the 20-day moving average and the Bollinger Band middle line, indicating a weak short-term trend.
The bears are still in control, but momentum is weakening. The MACD histogram shows that the downward momentum is weaker than in previous days, indicating that although the price is still falling, the selling pressure is not as strong as before.
The RSI is around 46, not yet in the oversold zone, suggesting there may be further downside potential.
On the hourly chart, the price is being suppressed by a descending trendline, with resistance around 69200. If it cannot break above this level, the rebound will be limited.
The Fear & Greed Index has fallen to around 10, indicating extreme fear, suggesting that retail investors are panicked. Interestingly, institutions seem to have stayed—data shows that Bitcoin ETFs saw a net inflow of $1.3 billion in March, and whales have cumulatively bought over 40,000 BT.
Retail investors are selling at a loss, while institutions are accumulating shares. This contrarian signal historically often indicates that the market is nearing its bottom.
Upside resistance: 69000-70000
Downside support: 67000-66000
Short-term trend is slightly weak and volatile, like being pulled back and forth within a "range," lacking a clear direction. The overall structure remains bearish. Institutions are quietly accumulating, but retail investor confidence is weak, making further declines possible! Be aware of the risks.
#CZ says Bitcoin is a hard asset #Trump's 48-hour ultimatum
{future}(BTCUSDT)
23
404
45

The Bitcoin Historian
Crypto Newbie
1h ago
Breaking news: The legal guidance issued by the U.S. Commodity Futures Trading Commission (CFTC) and the Securities and Exchange Commission (SEC) regarding Bitcoin and cryptocurrencies officially took effect today.
A decade of uncertainty has finally ended.
A brand new day! 🚀
41
407
45