A Decade of Change: The Definition of a Bear Market is Being Rewritten
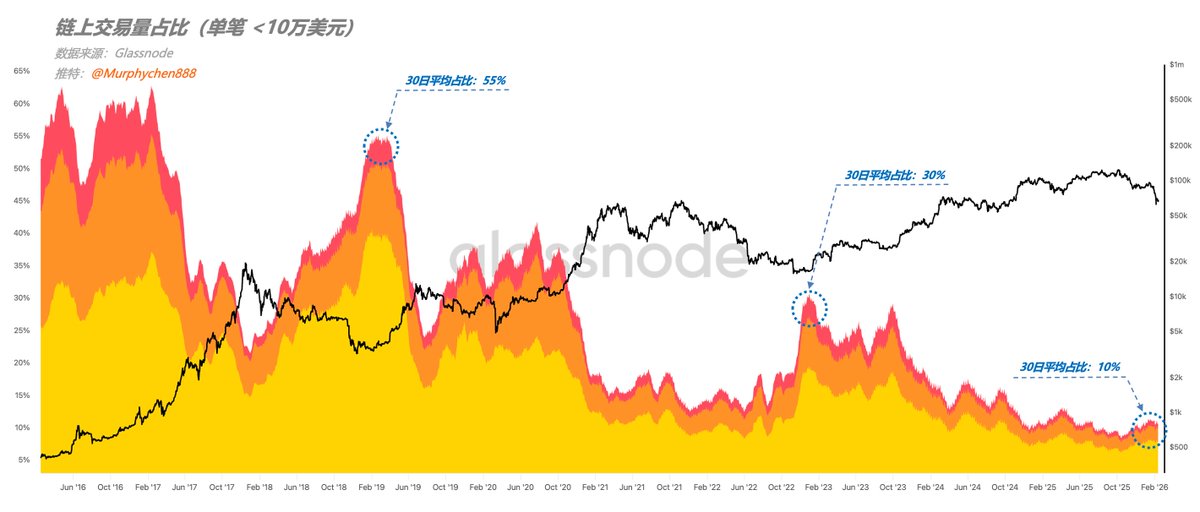
On-chain transaction volume reflects market activity. A bustling market with numerous participants demonstrates active investor participation and the increasing acceptance of BTC by a wider range of people and funds. Even if prices don't immediately improve, as long as people and money are involved, there is hope.
By differentiating the on-chain transaction volume of participants with different capital sizes, we can see the development and changes in BTC on-chain behavior over the past 10 years:
(Figure 1: On-chain transaction volume share of single transactions > $1 million)
The most intuitive manifestation is that whenever BTC begins to correct from its peak, it is accompanied by the continuous exit of large funds (single transaction size greater than $1 million), resulting in a continuous decline in their transaction share; while at the same time, the share of small funds (single transaction size less than $100,000) begins to rise.
This is particularly evident in the past two bull-to-bear cycles. For example, in February 2019, the share of large funds was as low as 15%, while the share of small funds reached 55% during the same period; indicating that the BTC market at that time was still in a stage of "large investors and retail investors" playing against each other.
(Figure 2: Percentage of On-Chain Transactions < $100,000)
This situation improved significantly by 2023. Even at the lowest point of the bear market, large funds still accounted for 40% of market participation, while small funds only accounted for 30%. This indicates that retail investors gradually withdrew from the BTC community's discourse power from this point onward.
However, in this cycle, even though BTC has retraced 50% from its peak, large funds' participation remains very high: the 30-day average percentage is a staggering 72%, while small funds only account for a mere 10%.
In the past, this would have been data from the peak of a bull market!
This means that large-scale on-chain transactions are now almost entirely occurring between large investors. That is, when one group of whales exits, another group of whales takes over. BTC has evolved from the original "large investors exit, retail investors take over" model to a "consensus shift between old and new whales" to reconstruct the bottom.
At this point, we should ask ourselves a question: If large funds haven't left, what are they expecting by remaining in the market? I think everyone will have a different answer.
------------------------------------------------
The reason I wrote this data analysis is because I saw several teachers on Twitter discussing "what will be the next narrative supporting BTC's price" a few days ago, and some even doubted whether there would be another bull market.
While I don't yet have a grand narrative in mind to support BTC's return to the $120,000 high in the next cycle, I'm not that pessimistic. Just because we can't think of it now doesn't mean it won't happen in the future.
Just like in 2023, we didn't expect BlackRock, the king of ETFs, to get involved, and before that, we also doubted whether BTC could return to the previous high of $69,000.
After all, we are not the rule-makers of the game; all we can do is "follow"—the smartest decision-makers in this market.
Okay, this should be my last on-chain data analysis of the Year of the Snake.
On this occasion, I also want to wish all my partners a Happy New Year! May everything go smoothly, may you be healthy, and have a Happy Chinese New Year!
Horses gallop across the Milky Way to usher in the new year; with a heart set on distant horizons, all roads lead to smooth paths!