Here's a follow-up analysis of today's ETH trend:
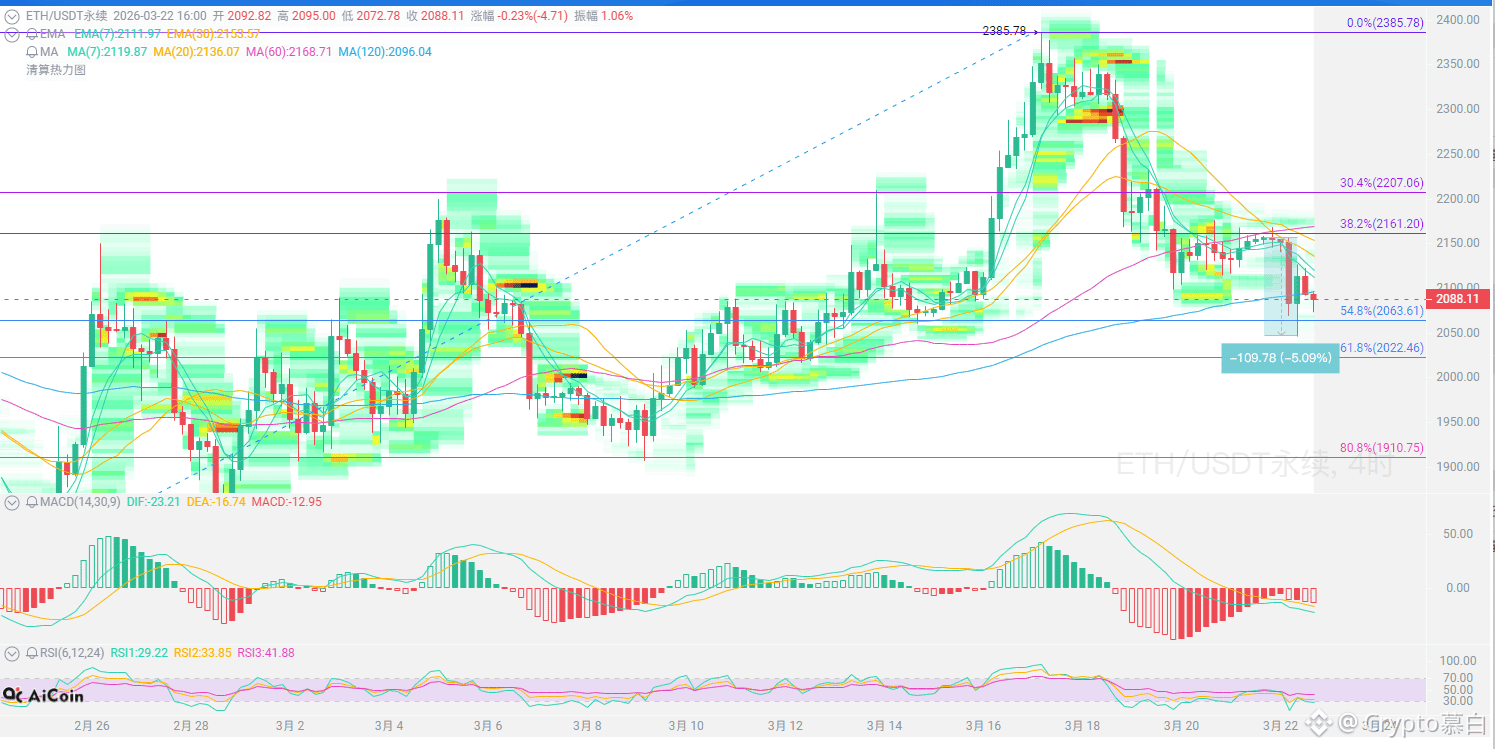
ETH has fallen by about 5% in the past 24 hours, reaching a low of around 2045. Looking at the candlestick pattern, it has been falling for several days on the daily chart, with the price sliding down from a high of 2385, a drop of over 10%. This has created a consolidation pattern with resistance above and support below.
Currently, the trend for ETH shows weakness and short-term pressure, moving downwards in tandem with BTC, but even more significantly. There are no signs of a major rebound in the short term, and the overall trend appears to be digesting previous highs.
Similar to BTC, the price is influenced by geopolitical factors and inflation, as well as profit-taking from previous highs and the release of short-term bearish momentum.
On the 4-hour chart, the price has broken below the MA5 (2130), MA10 (2137), and MA30 (2195) moving averages, which are in a bearish alignment, indicating a short-term bearish trend.
The MACD is still below the zero line. Although the histogram is starting to shrink, a golden cross hasn't formed, indicating that bearish momentum is still being released, albeit weakening. The RSI is around 45, neutral to weak, and hasn't reached the oversold zone yet, meaning there's still room for further decline.
Upside resistance: 2130-2150
Downside support: 2030-1990
ETH is currently in a consolidation pattern with support below and resistance above, and large whales are accumulating positions at the bottom. The trend remains weak, and selling on rallies is recommended!
#GoldPostsLargestWeeklyDropIn43Years #TrumpConsidesEndingIranConflict
{future}(ETHUSDT)