Let's analyze the trend of $ETH today:
From the daily chart, it broke below the Bollinger Band middle line at 2093, with the lower Bollinger Band around 1890, meaning there's still room for further decline. The daily MACD histogram turned green but continues to expand, and the RSI has fallen below 50, indicating that the bullish momentum has been exhausted, and the bears are now in control.
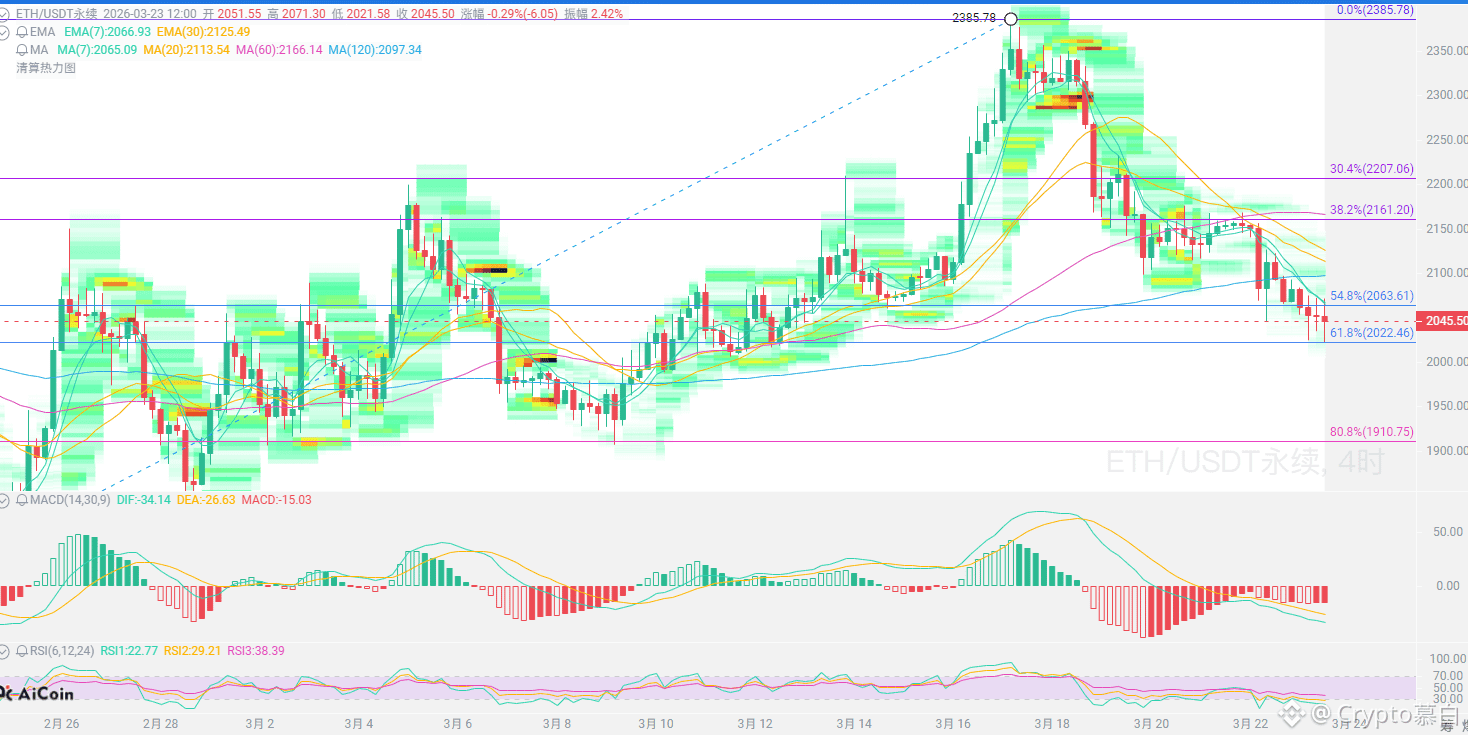
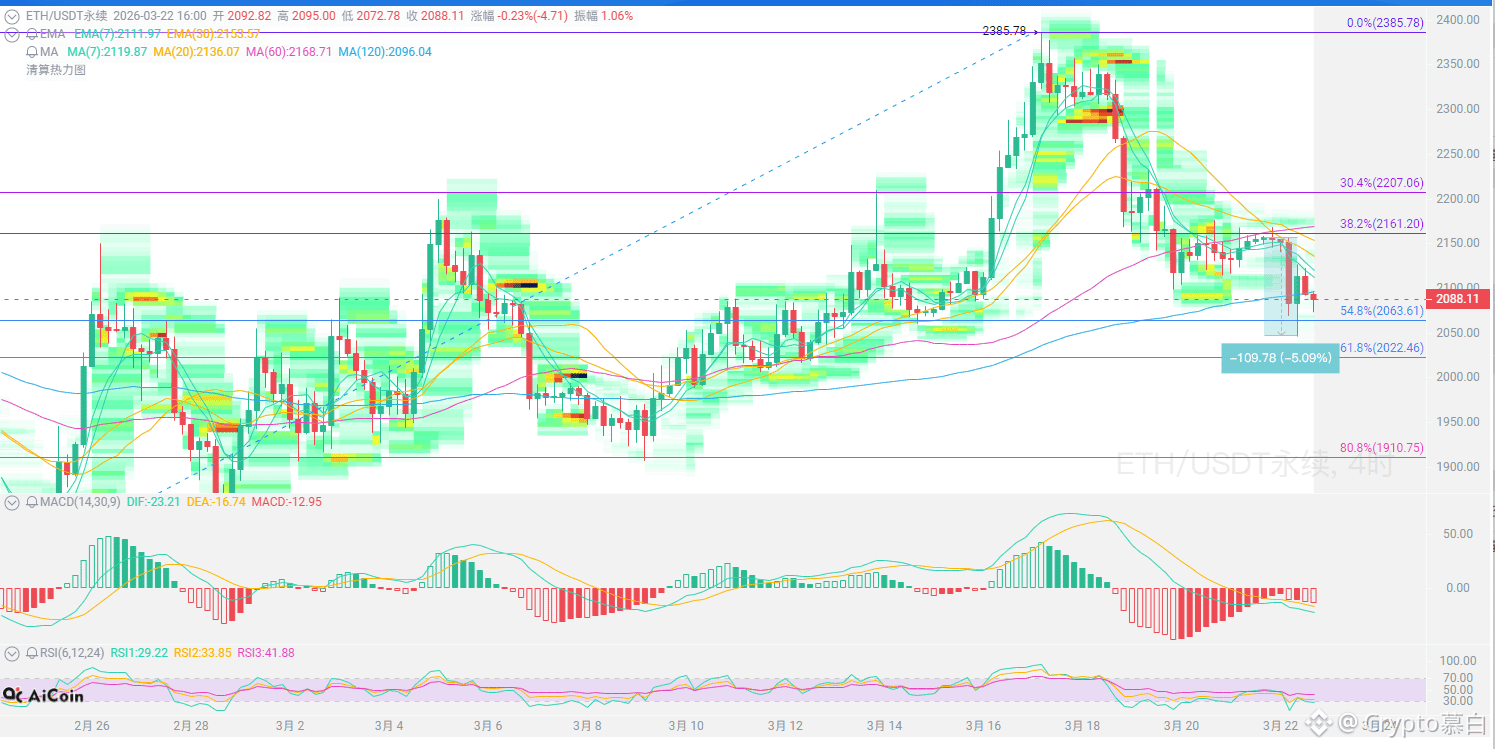
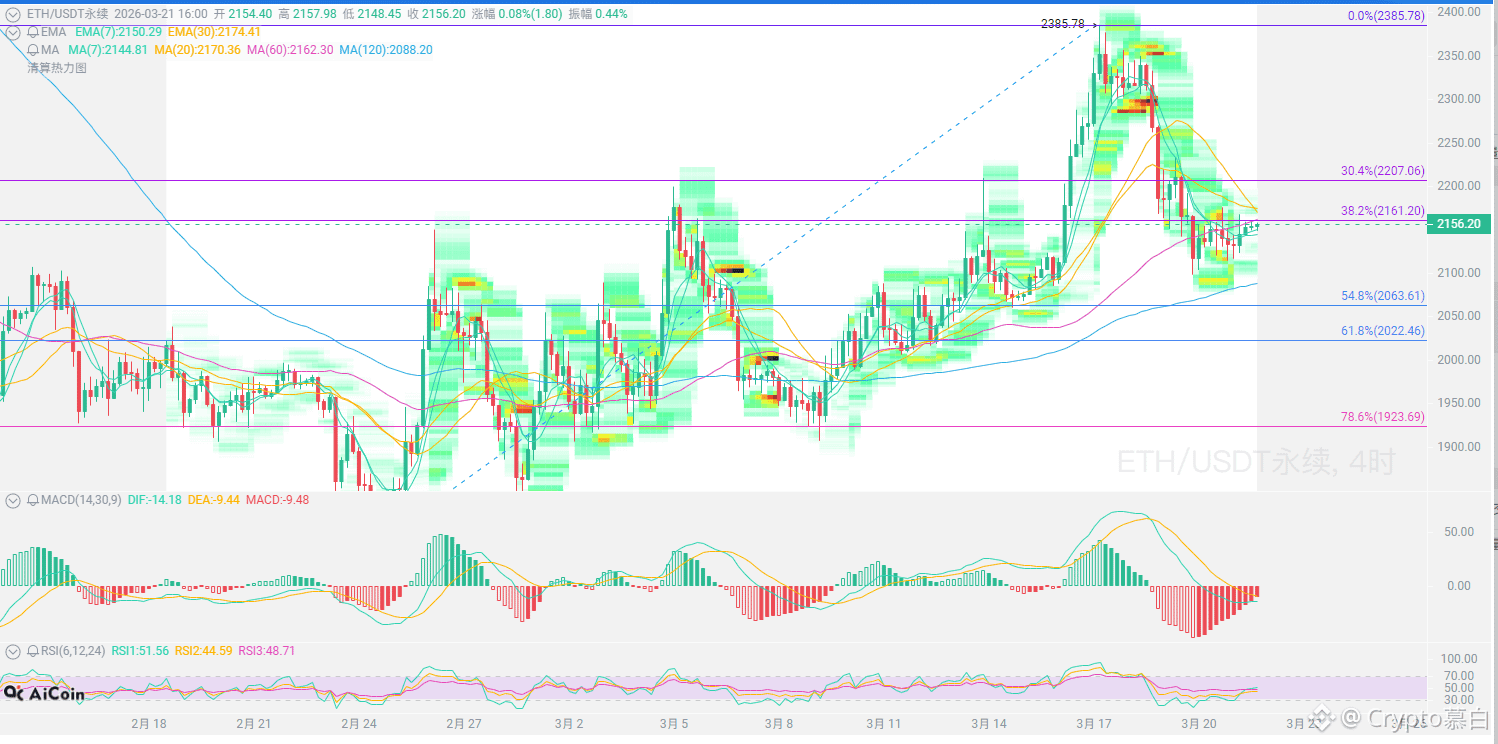
On the 4-hour chart, the price broke below the EMA, short-term moving averages are in a bearish alignment, the price is being suppressed by the Bollinger Band middle line, the MACD histogram continues to expand, and the RSI is around 45, indicating that bearish momentum is still being released, and the weak downward trend is clear.
ETH is currently in a weak pattern of "major players running away, retail investors buying," with the daily and 4-hour charts showing bears in control. 2000 is a key support level. If it holds, there might be a rebound to 2100-2120; if it fails to hold, the next target is 1900-1800. The trend remains bearish, and any rebound is an opportunity to sell!
Short-term resistance: 2100-2120
Short-term support: 2000-1980
ETH is currently in a medium-to-long-term downtrend channel, with short-term range-bound trading and weak rebounds!
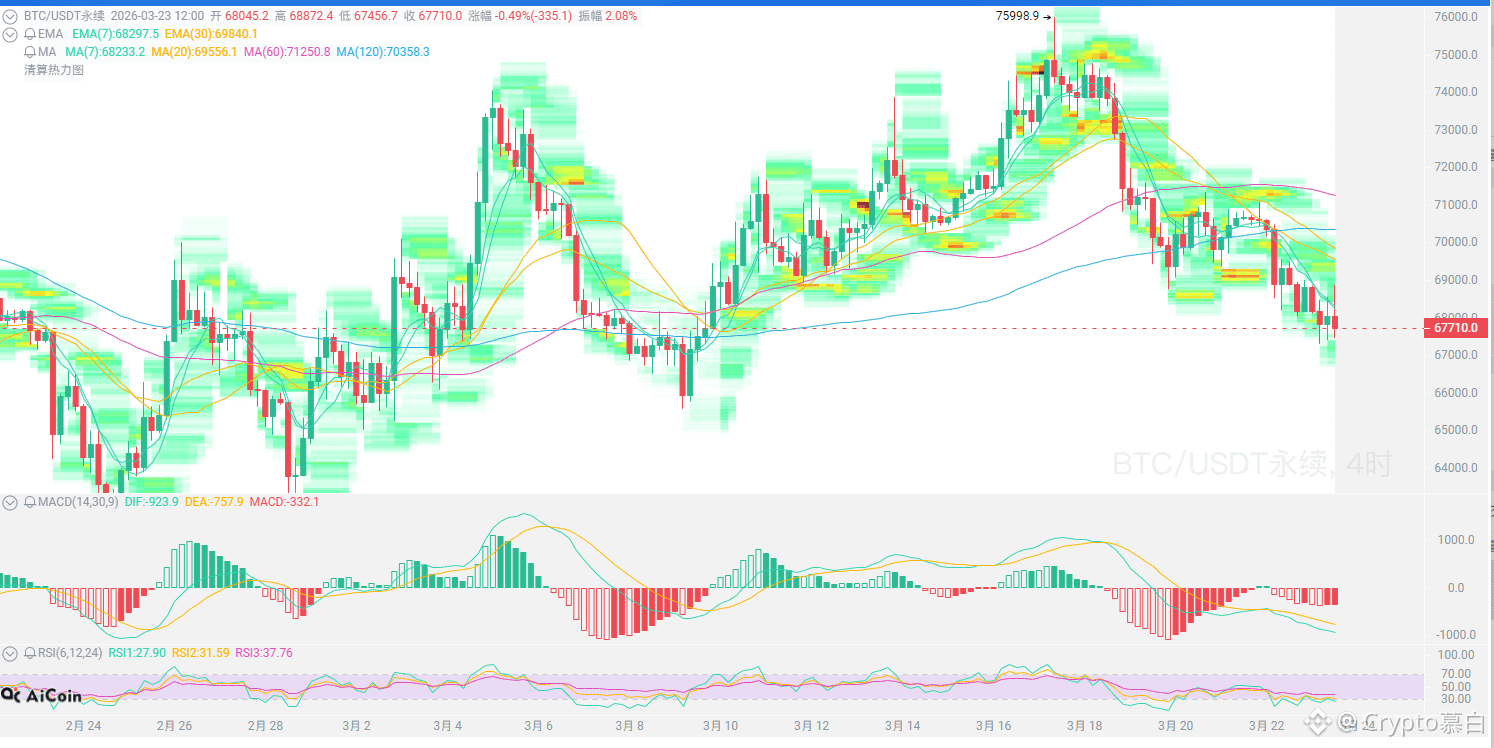
#CZ says Bitcoin is a hard asset #Trump's 48-hour ultimatum
{future}(ETHUSDT)

Price Converter

- Crypto
- Fiat
USDUnited States Dollar

CNYChinese Yuan
JPYJapanese Yen
HKDHong Kong Dollar
THBThai Baht
GBPBritish Pound
EUREuro
AUDAustralian Dollar
TWDNew Taiwan Dollar
KRWSouth Korean Won
PHPPhilippine Peso
AEDUAE Dirham
CADCanadian Dollar
MYRMalaysian Ringgit
MOPMacanese Pataca
NZDNew Zealand Dollar
CHFSwiss Franc
CZKCzech Koruna
DKKDanish Krone
IDRIndonesian Rupiah
LKRSri Lankan Rupee
NOKNorwegian Krone
QARQatari Riyal
RUBRussian Ruble
SGDSingapore Dollar
SEKSwedish Krona
VNDVietnamese Dong
ZARSouth African Rand
No more data