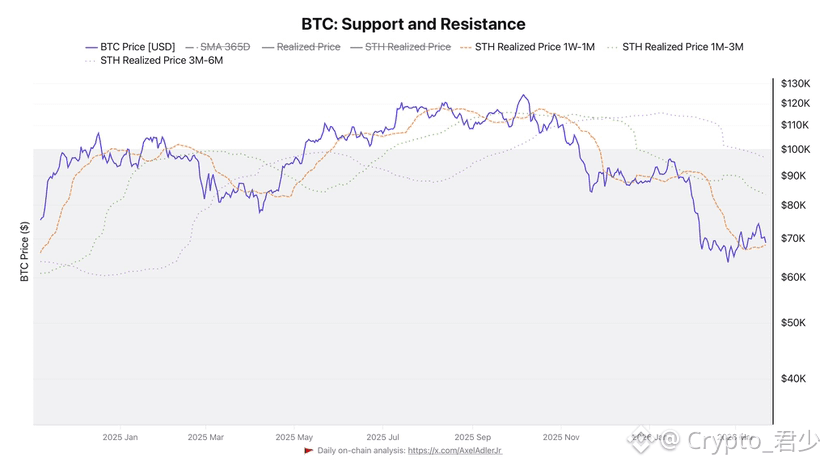
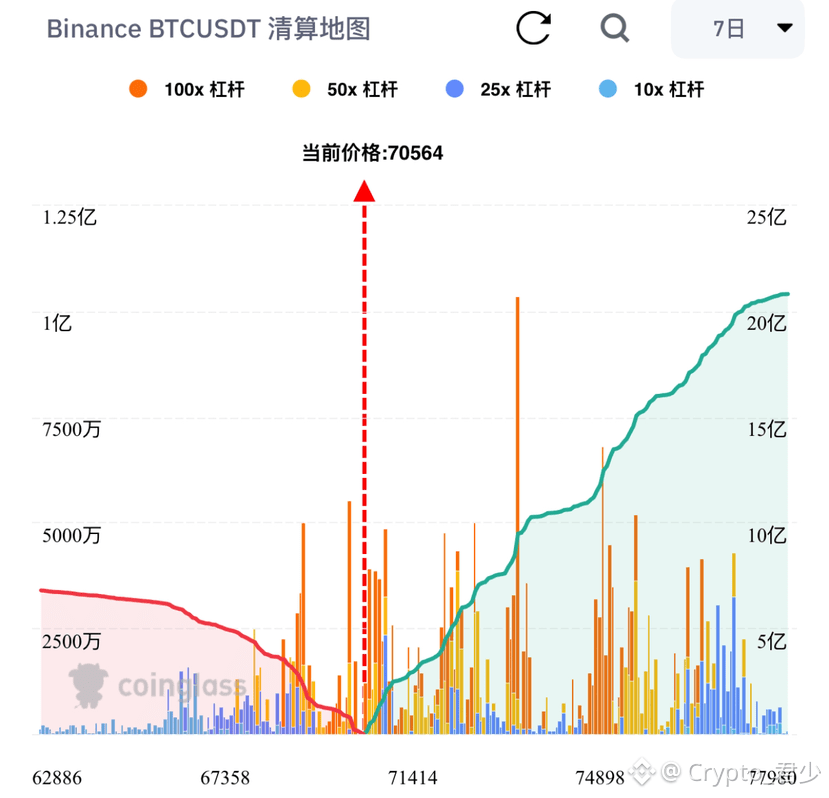
Where is the bottom in sentiment?
Where is the lifeline for institutions?
If you want to "buy the dip," do you understand the core divergence contradictions?
⚠️Recommended to save this!
▌BTC "Volume-Price Divergence" and "Time-Space Game"
╰┈✦Daily Chart (Support Game): Currently, there is a bullish divergence in OBV. Prices are declining, but funds are not panicking and withdrawing, which means that the chips are undergoing "passive turnover," rather than a "trend collapse."
╰┈✦Weekly Chart (Oversold Confirmation): The MACD has returned to the level of the deep bear market in 2022, indicating that the medium-to-long-term momentum indicators have bottomed out. OBV being higher than EMA confirms that this is a "high-level pullback with decreasing volume." As long as it doesn't break below key moving averages with high volume, this drop may be a deep shakeout.
╰┈✦Monthly Chart (Potential Hidden Dangers): The monthly OBV death cross is the core pain point. This suggests that if the closing price this month fails to recover, the large-scale capital flow will shift from bullish to bearish, preparing for months of wide-range fluctuations.
▌Point of Divergence Between Bulls and Bears
╰┈✦Bullish Logic: Bottom divergence support. Daily/weekly capital flows are significantly stronger than price performance, a typical high-level accumulation or shakeout. The 74k chart provides strong support.
╰┈✦Bearish Logic: Cyclical exhaustion. The monthly death cross means that even if the price rebounds, due to insufficient volume in the larger timeframe, it will be difficult to form a confluence of forces to break through 100k, easily leading to a bull trap followed by a gradual decline.
▌Are you willing to gamble?
Either this is the final "digging a hole," or it's a medium- to long-term "top."
╰┈✦Scenario A (74k holds): Confirmed as a weekly-level "bear trap shakeout." After the indicators correct, the price will quickly move away from the bottom area, initiating a corrective rebound to correct the monthly death cross. The daily RSI will show oversold divergence, forming a golden pit.
╰┈✦ Scenario B (Breaking below 66k): Confirms a monthly "trend reversal." At this point, the daily divergence becomes invalid, the OBV will experience a precipitous drop, and the market will enter a correction period lasting more than six months.
▌Key Advice: Bolun Point ➠ OBV support strength vs. MACD inertial downward movement.
➫Short-term trading: Closely monitor the 70000 - 74600 range. If the daily close is above this range and the OBV continues to flatten/rise, the success rate of establishing a position on the left side is high.
➫Risk control threshold: Once the price effectively breaks below 66k, all divergence logic becomes invalid, and a right-side reduction plan should be implemented. Losses of 50,000 or 40,000 BTC are possible.
$BTC $ETH