Topic Background

Silly Grandpa Talks Crypto
Crypto Newbie
1d ago
Institutional investors have entered the market, the winds have turned, and the current strategy is to closely follow the leaders and ride the wave. In this capital-driven digital goods boom, AVAX, DOT, and APT, with their irreplaceable commercial infrastructure attributes, have become the most certain strategic choices.
AVAX, with its institutional-grade security and ultra-low gas, serves as the cornerstone of global stablecoins;
DOT, with its cross-chain interoperability, constructs a high-speed highway for global asset transfers;
APT, with its high-performance engine, supports the high-frequency trading foundation for compliant finance.
Following Wall Street's lead and investing in these infrastructure-level leaders is the key to securing the greatest certainty in this capital wave. 🚀


39

335

49

Silly Grandpa Talks Crypto
Crypto Newbie
1d ago
🚨 The Underlying Logic Behind Wall Street's Heavy Investment: Public Blockchains as Infrastructure
AVAX, DOT, and APT have become Wall Street's top choices not because of hype, but because of their irreplaceable commercial infrastructure attributes:
$AVAX, with its institutional-grade security and zero gas, serves as the cornerstone of global stablecoins;
$DOT, with its cross-chain interoperability, constructs a high-speed highway for global asset transfers;
$APT, with its high-performance engine, supports the high-frequency trading platform for compliant finance.
Opera's heavy investment in Celo further solidifies institutional approval for the entire stablecoin public blockchain sector. The current opportunity lies in following Wall Street's lead and positioning oneself in this capital-driven digital commodity boom.

39
338
28
Silly Grandpa Talks Crypto
Crypto Newbie
1d ago
Opera's heavy investment in CELO is the strongest evidence that Wall Street considers stablecoin public chains a strategic necessity. This is no longer retail-level speculation, but an institutional-level strategic deployment.
The core logic is clear: digital commodities are no longer speculative hype, but have become the foundation of assets with verifiable ownership, transferability, and the ability to generate real returns.
Opera's exchange of 160 million CELO for cash essentially locks its revenue structure, company interests, and ecosystem growth into the Celo public chain system, making the listed company itself a "stakeholder on the chain."
This is the true era of digital commodities: public chains are not tokens, but commercial infrastructure.
Stablecoins are not tools, but the underlying liquidity for global payments.
Institutional entry is not short-term speculation, but anchoring its core business, revenue, and future growth to this public chain.
AVAX, DOT, and APT are Wall Street's top choices precisely because they possess this "commercial infrastructure" attribute.
AVAX offers institutional-grade security and ultra-low gas for global stablecoins; DOT supports global assets with its cross-chain architecture; and APT provides high performance for compliant, high-frequency trading scenarios.
Opera's significant investment in Celo is a testament to institutional recognition for the entire sector.
The real opportunity lies in following the trend and aligning with institutional strategies, rather than chasing highs and lows based on emotions.
28
372
33
Silly Grandpa Talks Crypto
Crypto Newbie
1d ago
AVAX, DOT, and APT are the preferred stablecoin public chains for Wall Street-listed companies. Avalanche (AVAX), with its sub-second confirmation, ultra-low gas, and institutional-grade security, deeply integrates with TradeFi and RWA, serving as the core carrier chain for USDe/USDC. It has received significant investment from Visa and BlackRock, leading in scale and recognition. Polkadot (DOT) dominates asset circulation through cross-chain interoperability. APT supports high-frequency, compliant scenarios with its high performance. Opera's significant investment in Celo further confirms that stablecoin public chains are becoming a strategic standard for listed companies, and the Wall Street landscape is clear.
Nasdaq giant Opera is openly manipulating Celo, planning to replace USD cash rewards with 160 million $CELO tokens, with a community vote imminent. This browser giant, with 14 million MiniPay users, is using a token conversion model that locks its own revenue with the Celo ecosystem, signaling strong control.
45
499
27
Silly Grandpa Talks Crypto
Crypto Newbie
03-21 14:36
In 2026, compliant interconnection has become the mainstream narrative. The integration of Aptos, DOT, and AVAX paves the way for institutional entry. On-chain data shows that large funds are continuously accumulating shares. After stabilizing above key moving averages, there is considerable upside potential. Abandon the obsession with bottom-fishing, build positions in batches on the right side to secure shares, and closely follow institutional liquidity trends.

26
306
41


Silly Grandpa Talks Crypto
Crypto Newbie
03-19 12:19
1. Mina: The world's smallest blockchain, with 22KB zero-knowledge proofs, offering unparalleled privacy and lightweight nodes.
2. RVN: A Bitcoin fork, focused on asset issuance, secure, simple, and free from speculation.
3. Mask: A social plugin-level Web3 entry point, allowing on-chain interaction without a VPN.
4. Celo: A mobile-friendly public blockchain with stablecoin payment convenience and extremely low fees.
5. AVAX: The pinnacle of high-performance public blockchains, fast, stable, EVM compatible, and boasting the strongest ecosystem.
23
478
29

BATTLE
Crypto Newbie
03-18 15:56
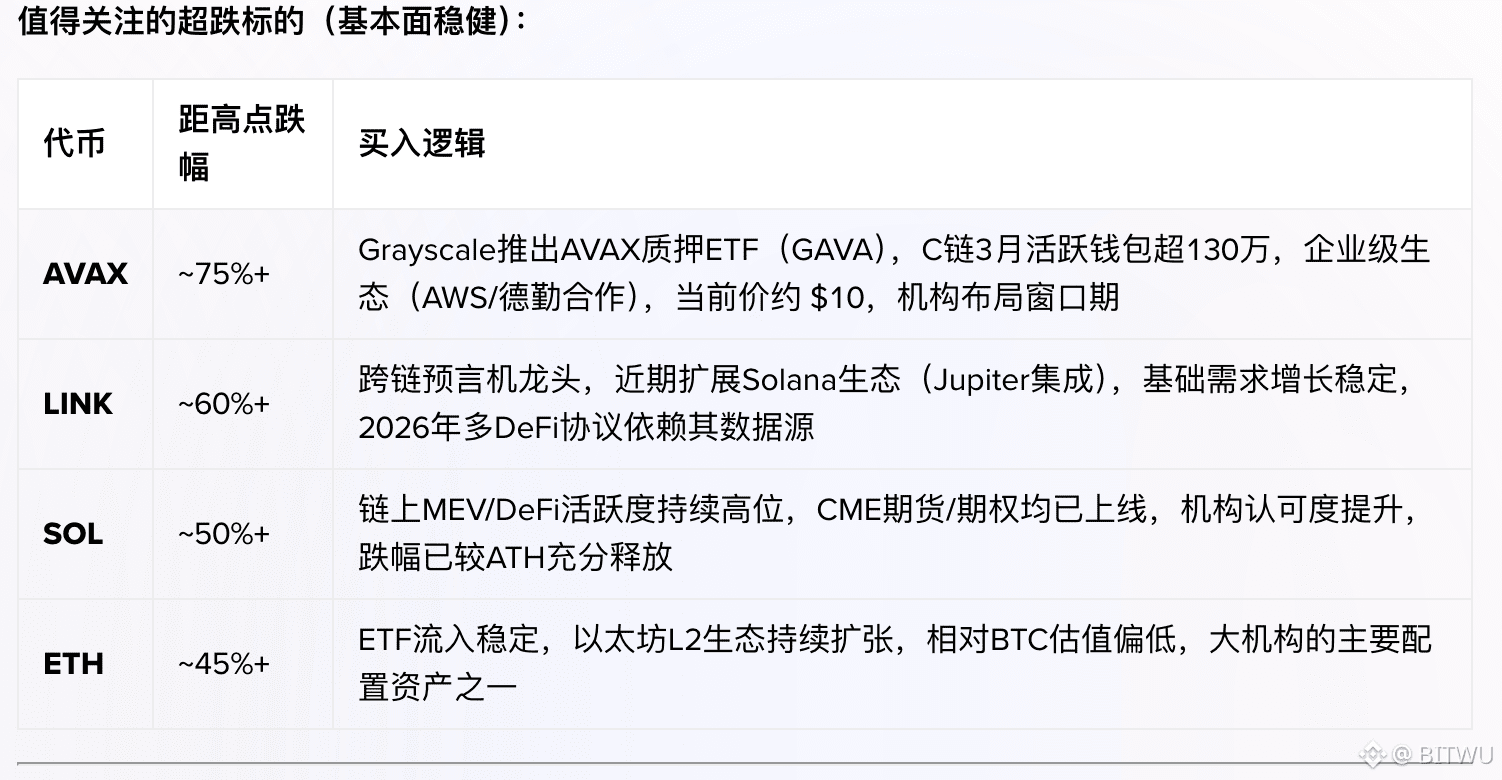
Oversold stocks worth watching (with solid fundamentals):
$AVAX $LINK $SOL $ETH
40
473
38
Silly Grandpa Talks Crypto
Crypto Newbie
03-18 00:30
TRX has no hard cap on issuance, and APT originally had an unlimited supply, leading to long-term inflationary dilution pressure and making its price easily diluted by incremental issuance. AVAX, RVN, and Celo all have code-level total supply caps, ensuring a certain supply and clear scarcity, making their long-term value more likely to be continuously driven up as their ecosystems expand.

24
464
32