#ETH
I reviewed the chart again, and my conclusion remains the same: I believe there's only one answer.
Surface Analysis:
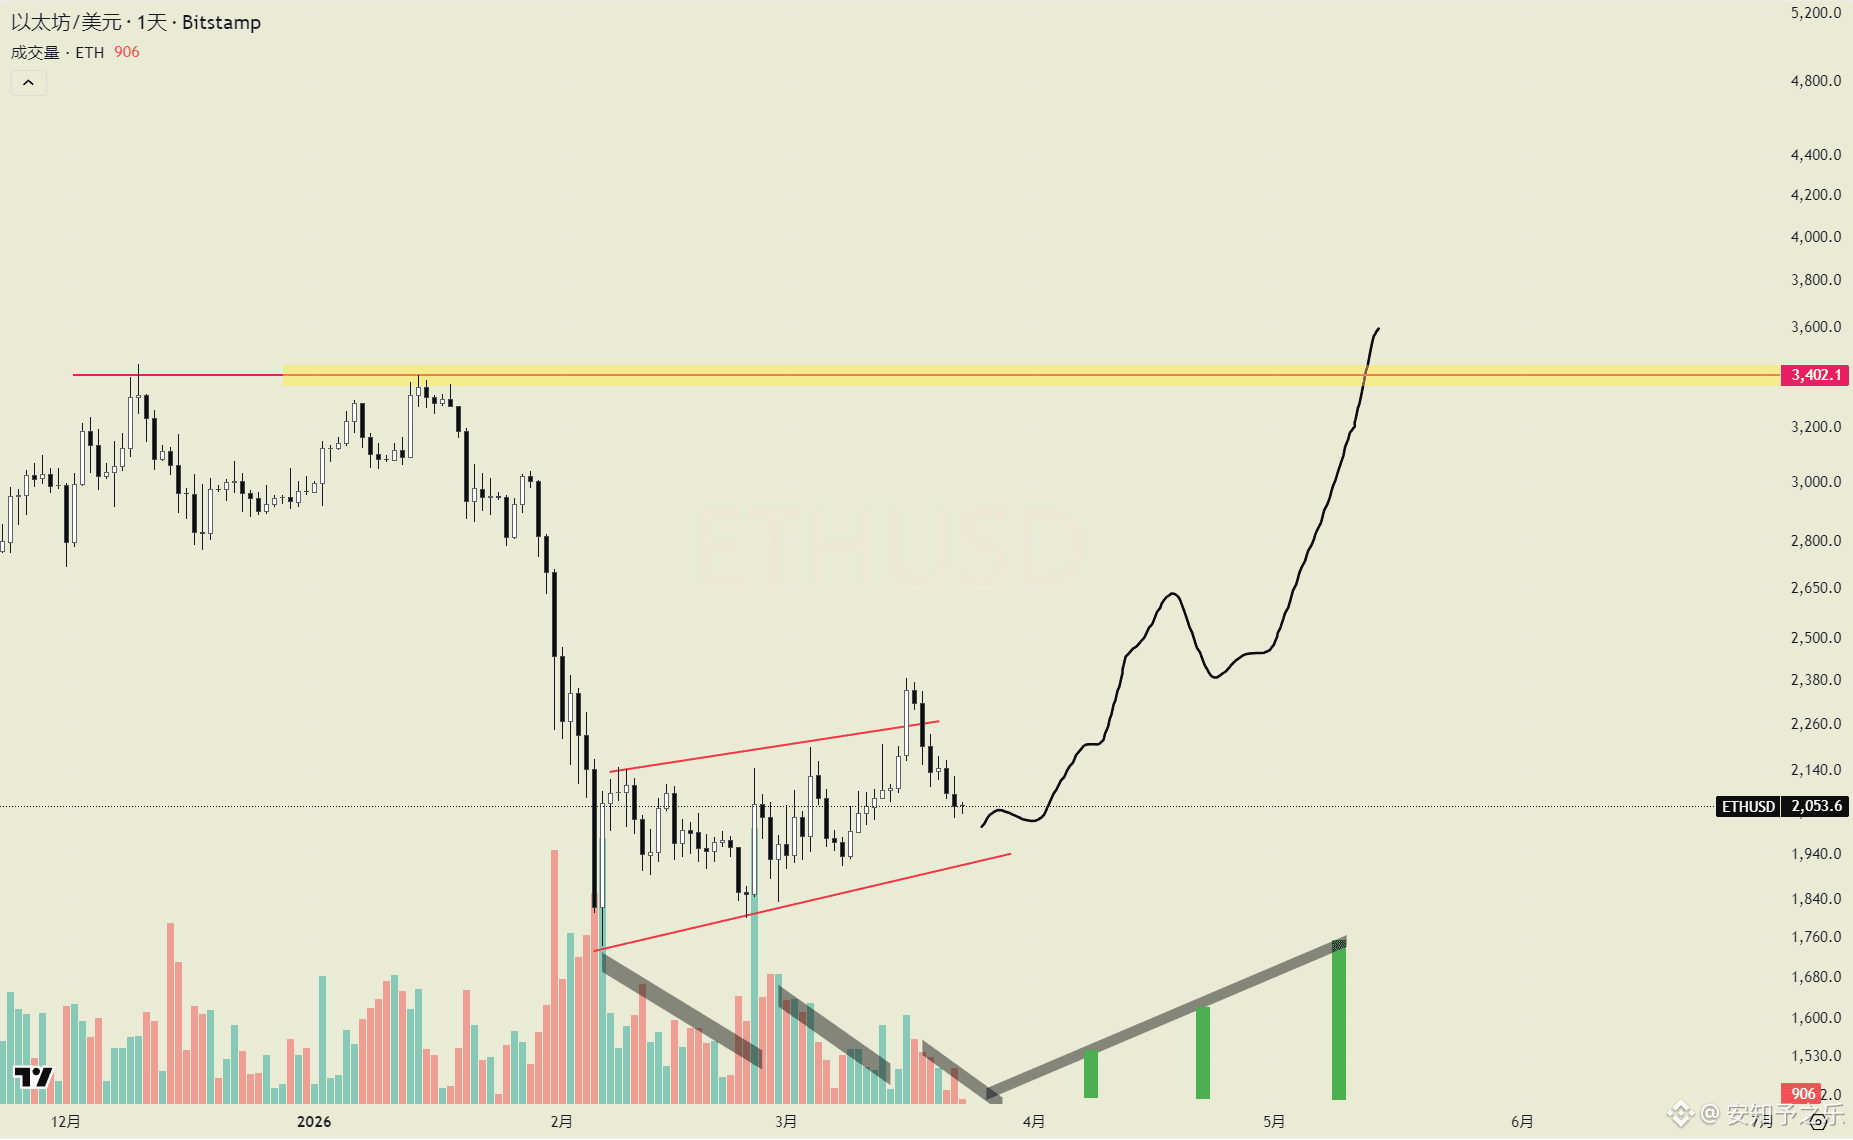
The short-term candlestick pattern (from 1750 to now) is very standard, a standard upward-sloping flag pattern in a bear market, complete with a false breakout. This structure is generally a precursor to a downward plunge.
This is the most direct and "easy-to-understand" signal the chart is currently providing, very similar to BTC's movement from May to June 2022.
But the question is, is it really that simple?
On the surface, it does look very similar, like the four-year cycle everyone has always believed in, which seems to have remained unchanged. But do you remember when BTC reached 120,000? Back then, the entire market was predicting 150,000 because, according to past cycles, October, November, and December are typically the main upward phase.
And this time? October, November, and December saw a continuous decline.
See? That's how the market works; if you're even a step behind, you can easily fall into a trap.
Essential Analysis:
So what I've been doing is trying to be one step ahead of the market. I generally don't just look at surface patterns, nor do I rigidly apply historical data (otherwise, I wouldn't have been able to go from a bearish outlook of 4900 to 1800).
In my view, the current situation is more like a preparatory phase before an upward move. From BTC at 60,000 and ETH at 1750 to now, several points are crucial:
① Compared to the previous consolidation range (December 2025 - January 2026), trading volume has significantly increased, which is quite unusual—the market is clearly more bearish, but liquidity is actually increasing.
② Even stranger, if you look closely, you'll find that demand is consistently present, but supply hasn't kept up significantly. This situation shouldn't be occurring at this stage.
③ And then there are the "bull market trap logic" I've repeatedly mentioned before (I won't elaborate here).
When you stop focusing on these candlestick patterns and stop comparing them to historical data,
you'll find that what the market is really brewing right now is only one thing: an upward trend.