At $68,654, would you dare to buy the dip in Bitcoin?
Geopolitical tensions have caused the market to plummet 3%, from $70,740 to $68,654. Whales dumped $100 million USDT in a single day, and 70% of Polymarket participants are betting on a drop below $55,000 this year. Retail investors are in a panic: what happened to the promised digital gold? How can it be more fragile than paper?
First, let's look at the surface: a bloodbath, a complete mess.
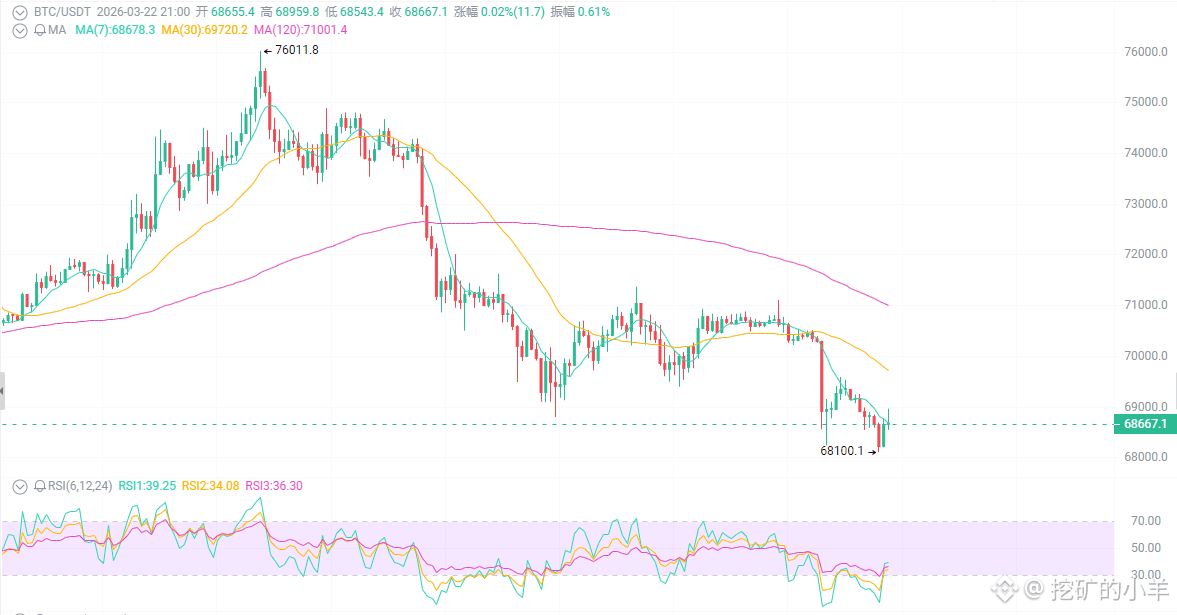
In the past 24 hours, BTC has fallen 3%, dropping from $70,740 to $68,654. The MACD has formed a golden cross, but look at the moving averages—the EMA24 and EMA52 are both in a bearish alignment, with a three black crows pattern and a hammer candlestick pattern. Technically, this suggests further declines are likely.
The first issue: Geopolitical tensions have arisen, what about its safe-haven appeal?
The escalating US-Iran conflict and the threat to the Strait of Hormuz have triggered a surge in global risk aversion. Logically, shouldn't digital gold have risen? The result? It followed the decline but not the rise. Why? Because funds are currently snapping up US dollars and gold; Bitcoin? It hasn't been its turn yet.
The second thing: Whales are dumping, but there are buyers.
Galaxy Digital has continuously transferred over 2000 BTC, with a total outflow of 102.4 million USDT—shocking, right? But look at the other side—Bitcoin spot ETFs are seeing continuous net inflows, and MicroStrategy is still increasing its holdings at high levels. This indicates that the dumpers are short-term whales, while the buyers are long-term institutions.
The third thing: The RSI has fallen to 22.33, which is extremely oversold.
The 6-period RSI is 22.33, and the 12-period is 27.16. What does that mean? This is a bottoming-out level. What happened after the last time the RSI reached this level? Go back and look at the candlestick charts to understand. A rebound from the lower Bollinger Band, a MACD golden cross, and a bottom reversal signal—**the technical indicators are telling you: a rebound is imminent.** On one hand, geopolitical factors are causing market volatility, whale selling, and Polymarket's bearish outlook reaching 55,000.
On the other hand, ETFs are seeing net inflows, institutional buying, and the RSI reaching extreme oversold levels.
The key level is 68,237; this is the final line of defense for both bulls and bears.
If you are a short-term trader: consider a small position near 68,237 for a rebound, targeting 69,000-69,500. Cut your losses decisively if it breaks below 67,950. Don't hold on, don't be greedy, and get out if it breaks down.
If you are a long-term trader: start building positions in batches between 68,000 and 69,200, setting a stop-loss at 67,500, with a target of 72,000. Institutional money is still flowing in, ETFs are still being bought—what are you panicking for?