What would happen if Bitcoin ($BTC) reached its target price of $45,000 or even $38,000 at the bottom of the cycle, as I've shown on multiple charts since September 2025?
In this scenario, Ethereum ($ETH) might attempt to absorb liquidity around $880 (the previous cycle low).
Do you think that price level is far off?
Remember, I warned many times when people predicted Ethereum would reach amazing prices in 2025. I said that if this happened, we could indeed reach massive levels above $21,000, but I didn't think it would succeed.
When liquidity was absorbed from the 2021 highs, I strongly warned that liquidity absorption was the most dangerous thing in the market. I used Solana and XRP as examples to illustrate how liquidity absorption signals the start of a bear market, but I was ridiculed by some so-called "technical analysts."
This target still holds true.
However, just as the previous upward momentum weakened and liquidity was drawn from the previous high (2021 high), the current decline is likely aimed at drawing liquidity from the previous low (2022 low).
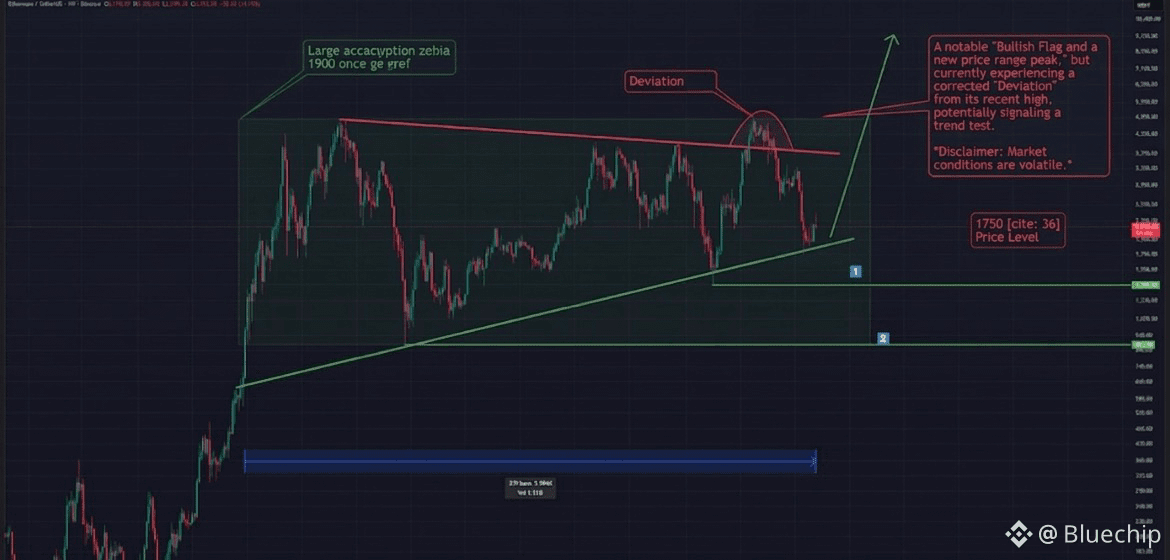
This would make the current range ($880 to $4,000) a long-term accumulation zone, potentially lasting over 1900 days before a significant upward move and new highs.
Key price levels to watch:
• A break below the recent low of $1,750 could lead to a rapid and sharp decline with no pause.
• If a cycle bottom does form, the next move could be a push towards higher highs, with numerous entry opportunities along the way.
In general, this requires more in-depth analysis, particularly a dynamic comparison between Ethereum and Bitcoin. However, this article aims to indicate where a potential bottom for Ethereum might form, just as I previously used multiple charts to analyze potential bottoming areas for Bitcoin.