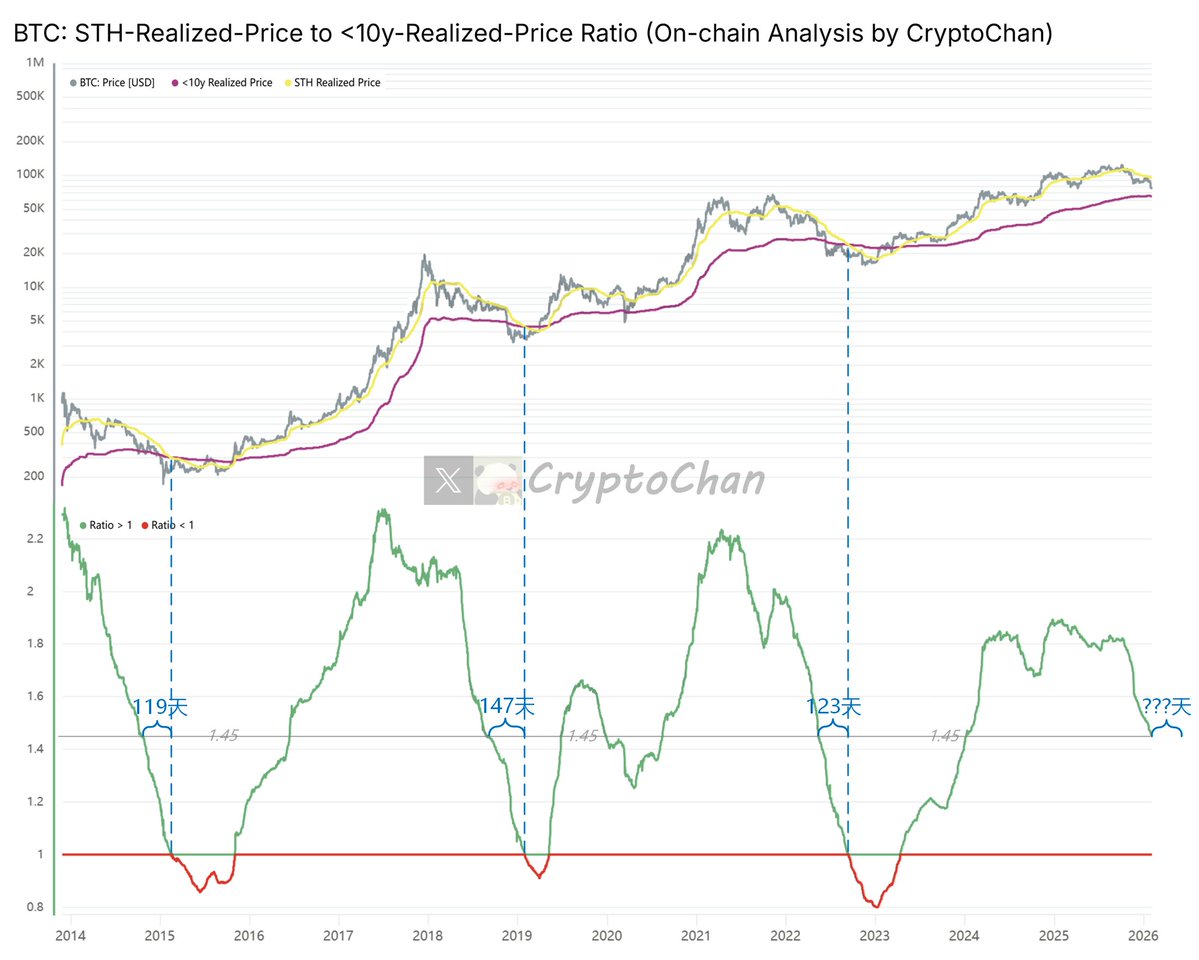
The indicator in the current chart has fallen to 1.45.
In 2014, it took 119 days for this indicator to drop from 1.45 to 1.
In 2018, it took 147 days.
In 2022, it took 123 days.
Note: An indicator reaching 1 generally indicates a bear market bottom.
The gray line at the top of the chart represents the #BTC price; the yellow line represents the average cost price for short-term BTC holders; the magenta line represents the average cost price for long-term BTC holders (excluding those held for more than 10 years).
The indicator at the bottom of the chart is the ratio of the "average cost price for short-term BTC holders" to the "average cost price for long-term BTC holders (excluding those held for more than 10 years)" (i.e., yellow line / magenta line).
The average cost price for short-term BTC holders is defined as investors or entities that have held Bitcoin for less than 155 days. This indicator reflects the cost basis of recent market entrants, who tend to be more sensitive to price fluctuations and more likely to sell their positions during market volatility or downturns. It is often seen as a barometer of short-term market sentiment and momentum: in a bull market, prices are typically above this average cost; in a bear market, prices falling below this level can trigger further selling pressure.
The BTC Long-Term Holder Average Cost is defined as the cost basis of investors or entities that have held Bitcoin for more than 155 days. This indicator excludes holdings held for more than 10 years (lost or extremely long-term immobile assets, such as Satoshi's coins) to focus on a more "active" group of long-term holders. These extremely long-term holdings have extremely low costs and are unlikely to move, thus excluding them provides a more realistic LTH cost basis, reflecting the average holding price of long-term investors who are likely to actually participate in buying and selling throughout market cycles. This indicator is often seen as a reference for market fundamental support levels: in a bear market, it may serve as a potential price bottom.
The ratio (average cost of BTC short-term holders / average cost of BTC long-term holders) reflects the stage of the Bitcoin market cycle and the dynamics of participant behavior:
Ratio > 1: Indicates that the average cost of short-term holders is higher than that of adjusted long-term holders. This typically occurs in bull markets, where recent entrants buy at higher prices, while long-term holders have a lower cost basis (even excluding extremely long-term holdings). This suggests optimistic market sentiment and strong new capital inflows, but may also foreshadow overheated speculation or a potential pullback.
Ratio < 1: Indicates that the average cost of short-term holders is lower than that of adjusted long-term holders. This is common in bear markets or market bottoms, where recent entrants buy at lower prices, while long-term holders have a higher cost basis (reflecting their holdings across the cycle). This is often a signal of surrender, suggesting that weak hands have been cleared out and the market may be heading towards recovery or the start of a bull market.
General meaning: An upward trend in the ratio indicates that the cost of short-term holders is increasing relative to long-term holders, marking a "numerical rise" phase or the continuation of a bull market; a downward trend indicates that the cost of long-term holders is increasing relative to short-term holders, marking a bear market or distribution phase. Excluding holdings >10 years brings LTH's cost closer to active market participants, avoiding the distortion of the ratio by low-cost lost coins, thus more accurately capturing cyclical turning points (such as the transition from a bear market to a bull market). Historically, when the ratio falls below 1, it often presents a long-term buying opportunity.