Mid-term of the last bear market
┌── 📑 𝗗𝗲𝗲𝗽 𝗗𝗶𝘃𝗲 | Indicator Details ──┐
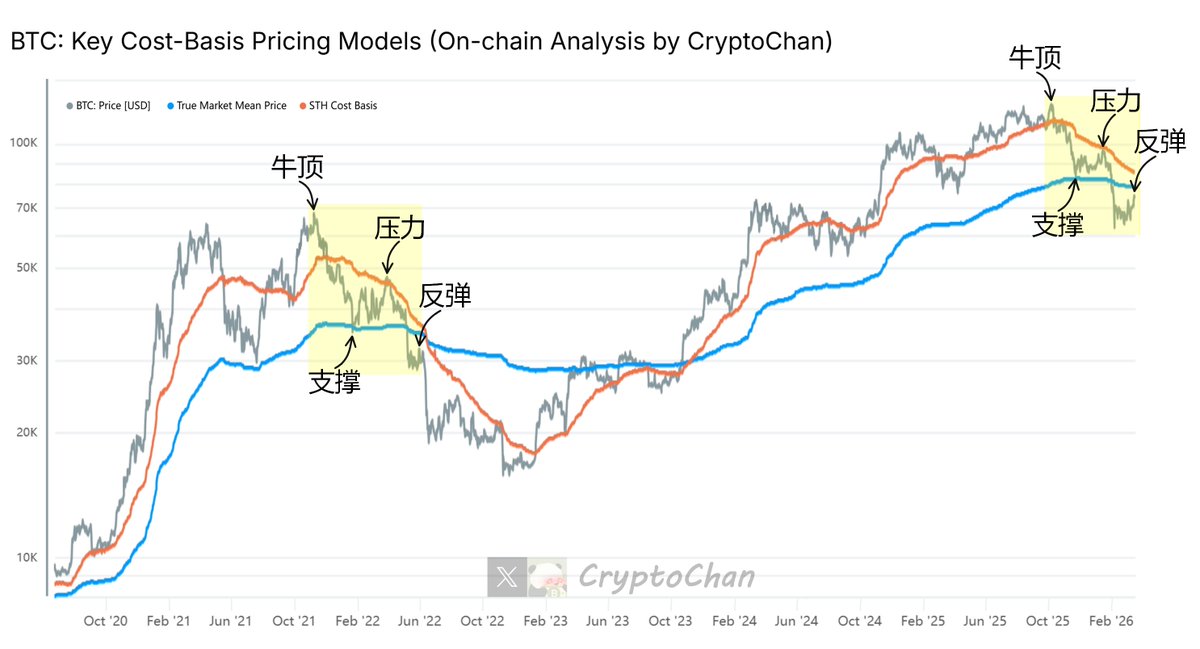
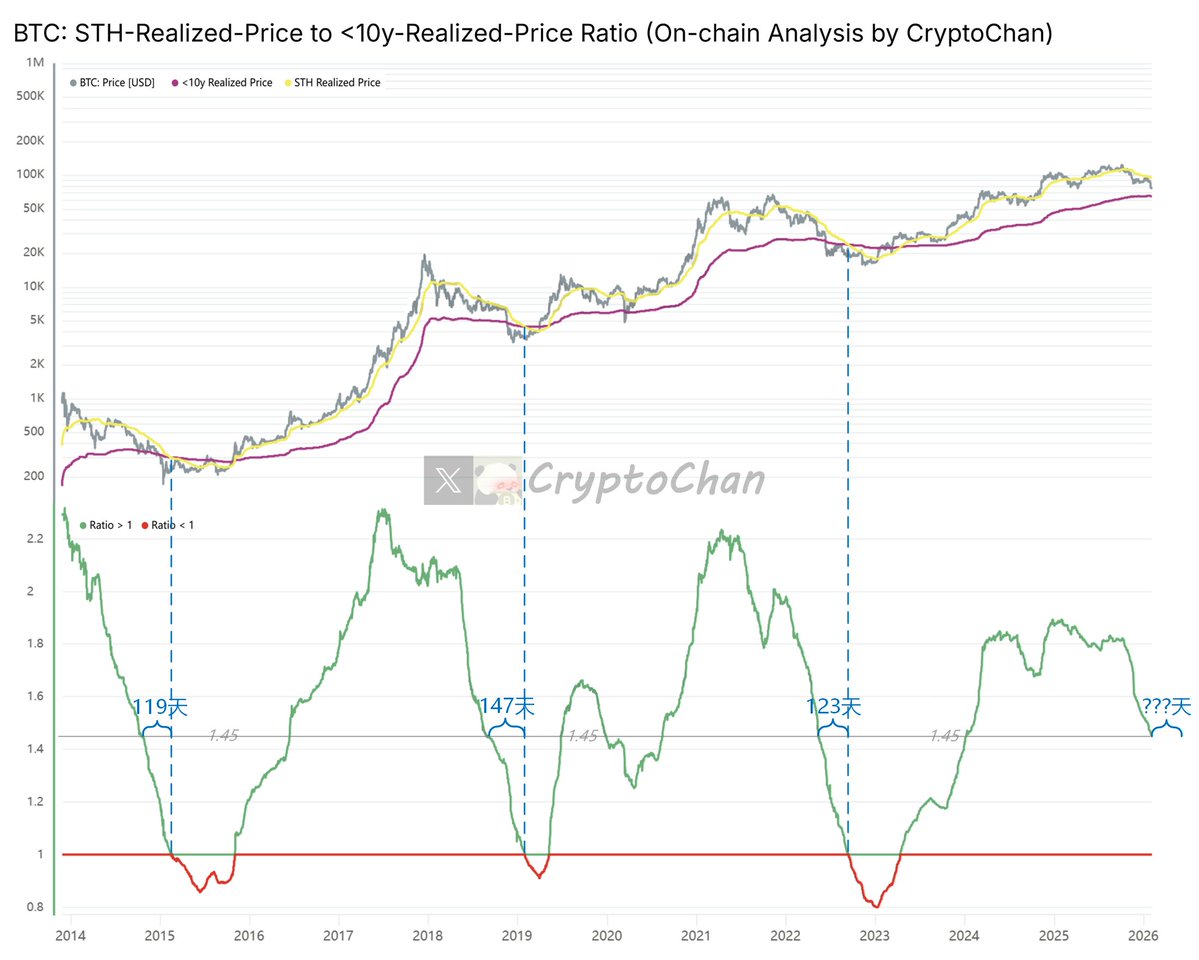
The gray line in the chart represents the #BTC price; the red line represents the average purchase cost of Bitcoin by short-term holders (Short-Term Holders Realized Price); the blue line represents the average purchase cost of Bitcoin in the true market (True Market Mean Price).
The average purchase cost of Bitcoin by short-term holders (typically defined as those who have held Bitcoin for less than 155 days and whose coins have recently moved on-chain) is calculated as the average purchase cost of their holdings. It reflects the average purchase cost of recent market entrants (often referred to as "weak hands" or active traders).
The average purchase cost of Bitcoin in the true market is also known as the "active investor price." It's not simply the average realized price of all cryptocurrencies, but rather a specific calculation for coins actively traded in the secondary market: the formula is Investor Cap (investor market capitalization, excluding Bitcoin mined by miners but not traded on the secondary market) divided by Active Supply (time-weighted active supply, excluding long-dormant and lost coins). This reflects the true average purchase cost of genuinely active investors in the market (excluding newly minted coins, lost coins, and long-term inactive holdings), and is considered the most accurate aggregated purchase cost model to represent the "true market mean."
The average purchase cost of short-term holders focuses on the costs of "short-term, sensitive groups," suitable for short-term sentiment and support/resistance assessments; the true market average purchase cost focuses on the true mean of "all active investors in the market," suitable for medium- to long-term trend assessments and bull/bear market demarcation.
Using both together provides a more comprehensive understanding of the cost structure of different Bitcoin holder groups and the market's short- and long-term trends.

Price Converter

- Crypto
- Fiat
USDUnited States Dollar

CNYChinese Yuan
JPYJapanese Yen
HKDHong Kong Dollar
THBThai Baht
GBPBritish Pound
EUREuro
AUDAustralian Dollar
TWDNew Taiwan Dollar
KRWSouth Korean Won
PHPPhilippine Peso
AEDUAE Dirham
CADCanadian Dollar
MYRMalaysian Ringgit
MOPMacanese Pataca
NZDNew Zealand Dollar
CHFSwiss Franc
CZKCzech Koruna
DKKDanish Krone
IDRIndonesian Rupiah
LKRSri Lankan Rupee
NOKNorwegian Krone
QARQatari Riyal
RUBRussian Ruble
SGDSingapore Dollar
SEKSwedish Krona
VNDVietnamese Dong
ZARSouth African Rand
No more data