[Big Speculation: The "Little Bear Bottom"]
Everyone is becoming increasingly adept at identifying the bottom of a coin's price chart, but currently, the market seems to lack a certain perspective: if the current bull market peak didn't reach the historically anticipated level, will the bear market bottom also fall to that level?
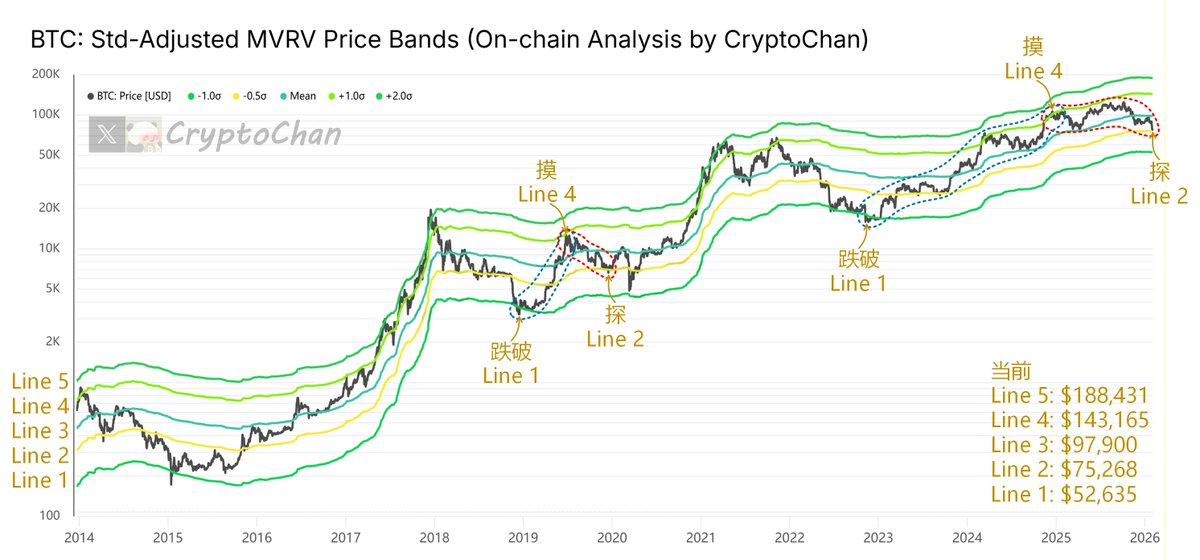
I happen to have a price model based on the #BTC:MVRV indicator difference. This model statistically standardizes MVRV by introducing the cumulative arithmetic mean and cumulative standard deviation, and uses five lines to comprehensively divide Bitcoin's historical price.
Historically, under normal circumstances, a transition from bear to bull and back to bear will see the price rise from Line 1 to Line 5 and then fall back to Line 1 (taking about 4 years).
The 2019 "mini bull market" was an exception; the price rose from Line 1 to Line 4 and then fell to Line 2.
The current bull market is similar in that the price also rose from Line 1 to Line 4 and then fell back to Line 2 (currently, the price at Line 2 is $75,268).
Therefore, I propose a bold conjecture: since the peak of this bull market did not reach the historically expected height (Line 5), the bottom of the bear market will also not fall to the historically expected depth (Line 1).
Perhaps this bull market is just an extended "mini bull"? Perhaps 74k is the "mini bear bottom"? Everything will be answered by time and the cycle.