It's been a while since I've done an in-depth market analysis.
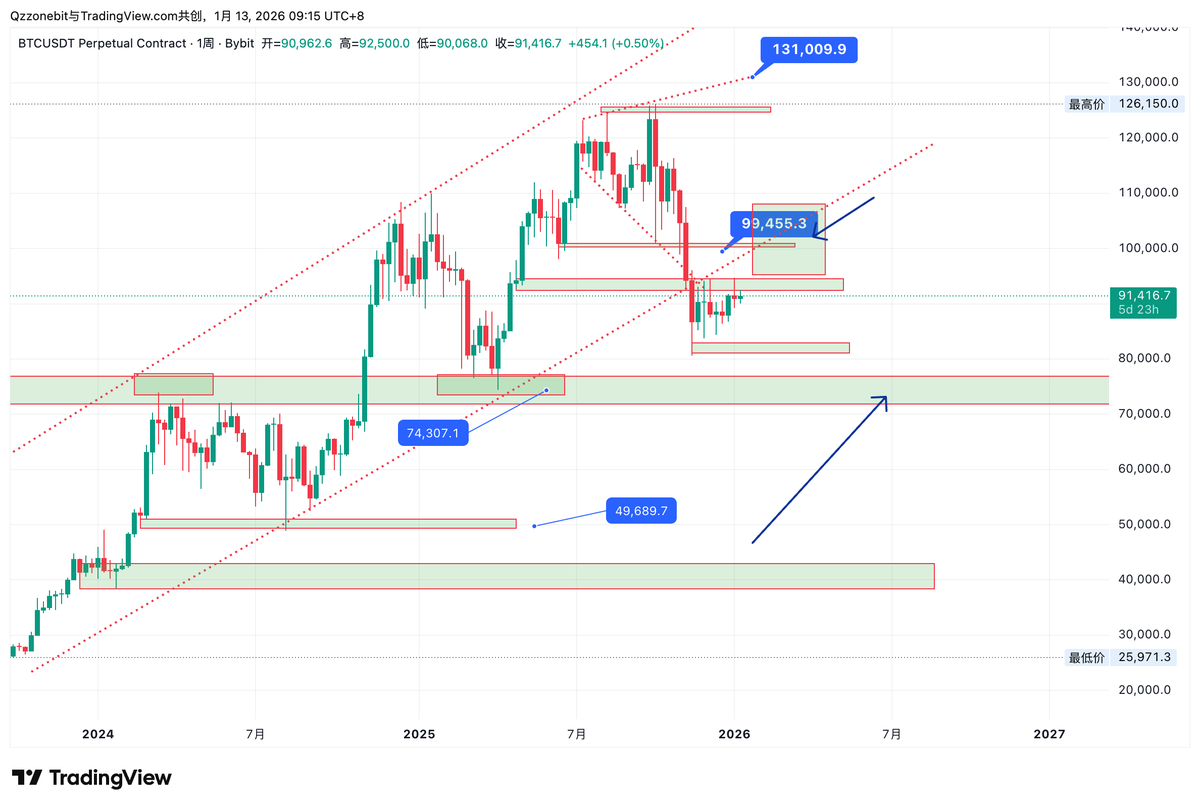
Let's talk about the potential expectations for Bitcoin: Beware of a false breakout trap at 99.
On the daily chart, it's been in a wide range of fluctuation between 84 and 94 (around 10,000 points) for two months.
The weekly channel has been broken, but a demand zone has also formed.
So, the two key levels on the daily and weekly charts are 9.4 and 9.9. One indicates the start of a move from a low to a high, and the other indicates a strengthening market.
Potential expectations and traps:
8.9 is the recent support level. Above this level, there's an expectation of reaching around 9.85, with confirmation at 9.29. The trap is a false breakout of the ultimate target of 9.85.
Therefore, in the short term:
Support: 8.9, 8.7
Resistance: 9.29, 9.45
Combining the daily range and key levels, the two short-term structural turning points
are where trading opportunities lie.
Pay close attention to false breakouts near the expected targets. The long-term entry point for spot trading remains unchanged; when it reaches that level, act!