$BTC
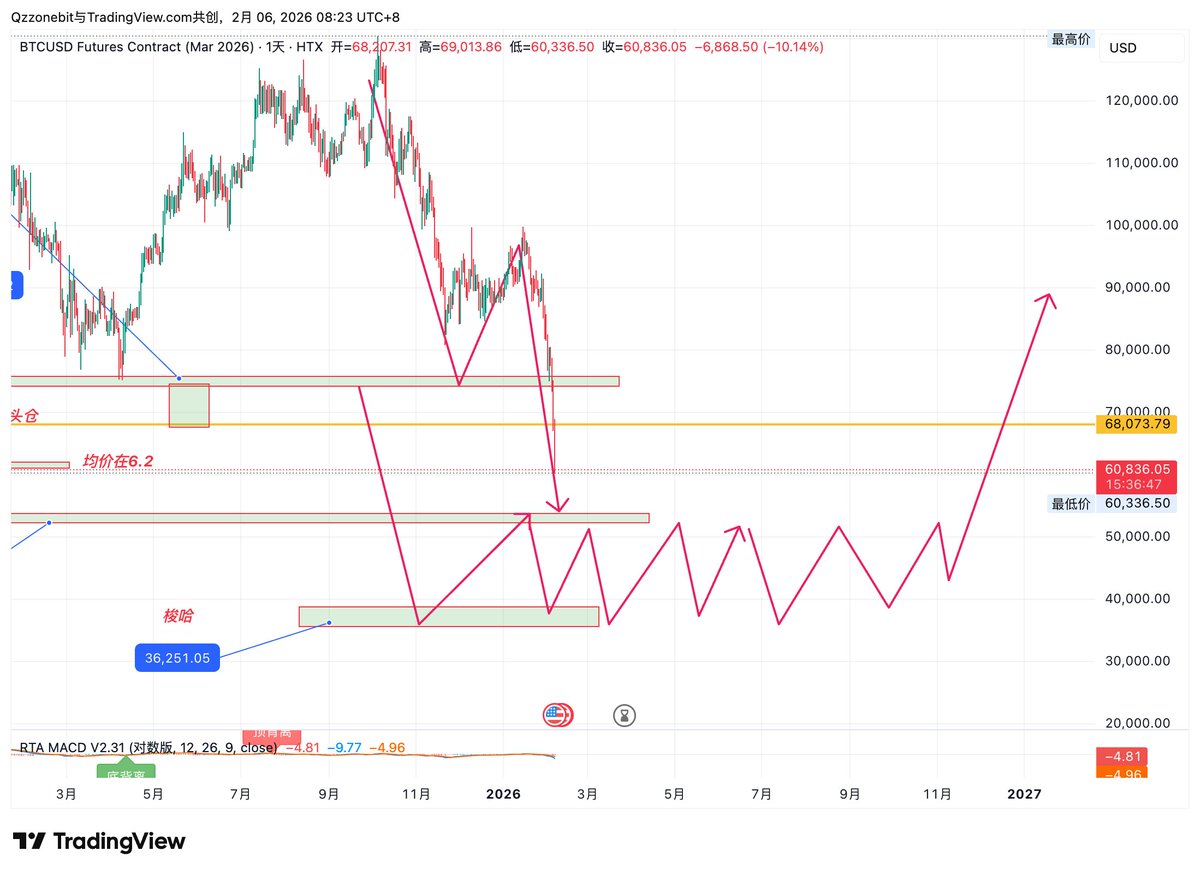
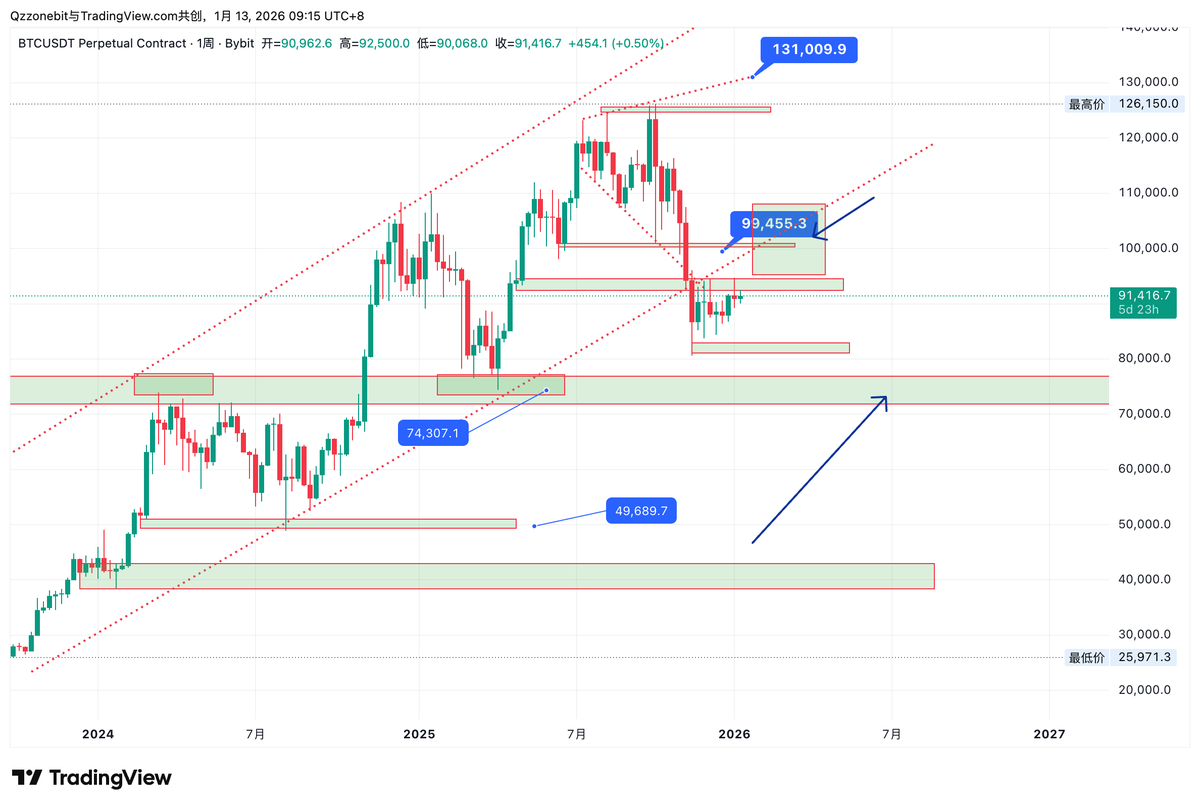
First, let's discuss the larger timeframe:
Structurally speaking,
Based on the expected ABC structure of the pullback that started around 97 in January, the target is around 55-52.
On the weekly chart, it's a weekly-level consolidation, or rather, a weekly correction. The 74-76 range is also the neckline of this bull market (as important as the weekly trendline around 76!).
Therefore, in the larger timeframe, our entry around 6 is still valid, and adding to positions starting at 55 should still be strictly followed.
Failure to recover 76 doesn't constitute a trend reversal.
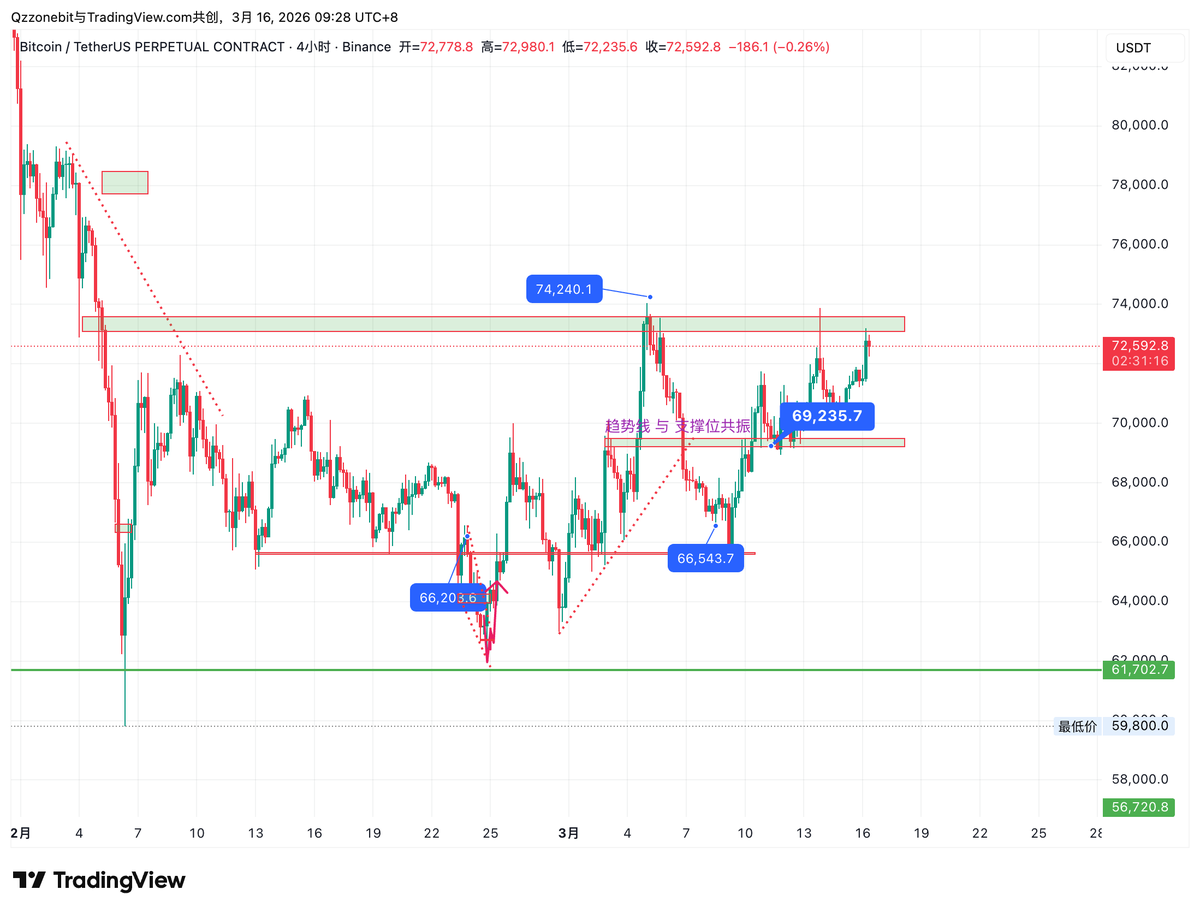
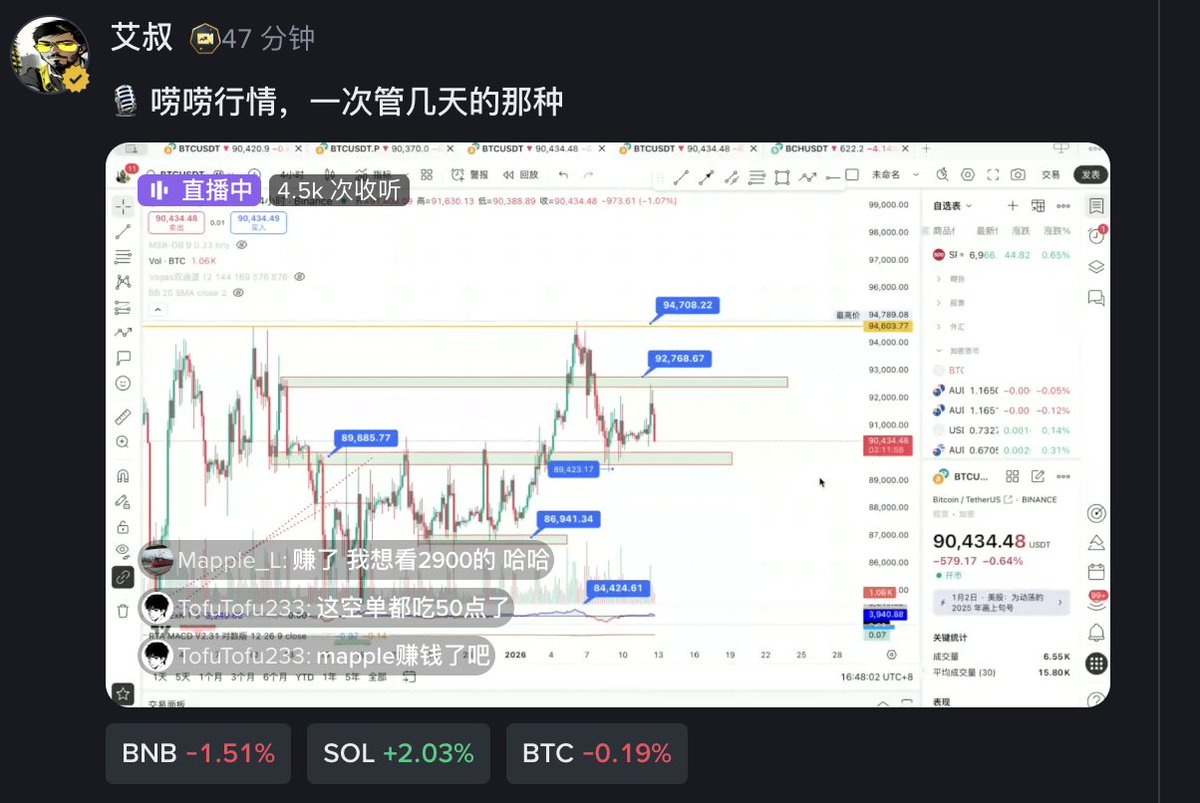
Recent short-term view: Chart 2
This range is as important as the 97 area; even if we're wrong, we'll actively take the hit.
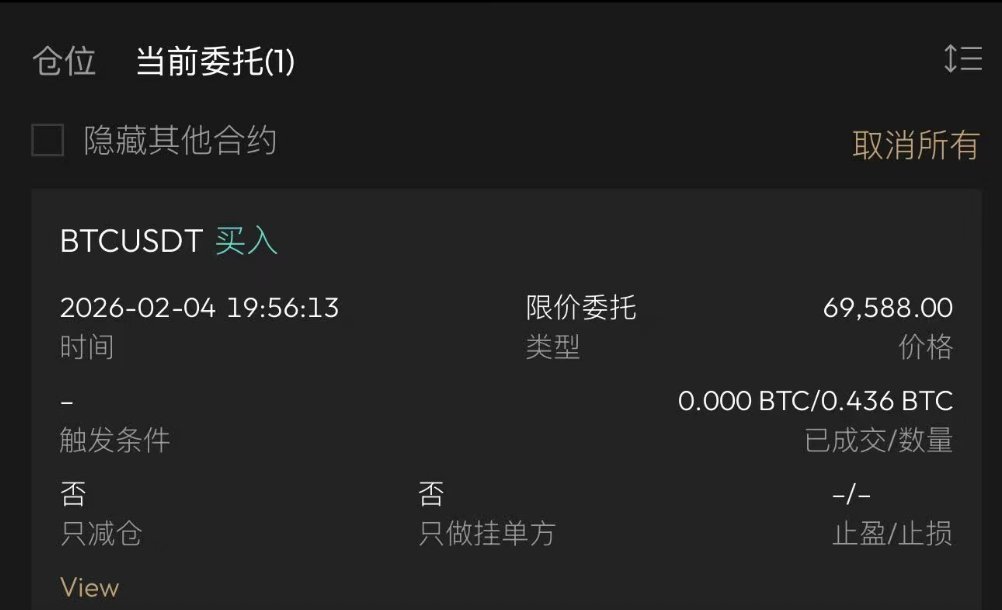
Last week, we used 658 as the starting point for the upward move; this week, it's 693. Above this, the target is around 76. Below, we wait for a return to the lower edge of the range. Therefore, the lower support levels at 6.6 and 6.45 are good entry points for trading.
Strategy Summary:
Cyclical positioning: Start building spot positions in batches from 6, with entry points at 6, 5.5, 5, and 4.2 (For positions established in February, do not add to these levels unless a new low is reached or a right-side structure forms after 76).
These key levels are suitable for trading larger-cycle contracts, except around 6 for right-side trading.
Short-term:
Resistance: 7.45 (This level is not new; avoid trading near this level unless it's a right-side move) 7.65
Support: 693, 6.6, 6.4
Trade at these levels.
Also, do not follow the example of the recent trend of blindly trading without identifying signals.

Price Converter

- Crypto
- Fiat
USDUnited States Dollar

CNYChinese Yuan
JPYJapanese Yen
HKDHong Kong Dollar
THBThai Baht
GBPBritish Pound
EUREuro
AUDAustralian Dollar
TWDNew Taiwan Dollar
KRWSouth Korean Won
PHPPhilippine Peso
AEDUAE Dirham
CADCanadian Dollar
MYRMalaysian Ringgit
MOPMacanese Pataca
NZDNew Zealand Dollar
CHFSwiss Franc
CZKCzech Koruna
DKKDanish Krone
IDRIndonesian Rupiah
LKRSri Lankan Rupee
NOKNorwegian Krone
QARQatari Riyal
RUBRussian Ruble
SGDSingapore Dollar
SEKSwedish Krona
VNDVietnamese Dong
ZARSouth African Rand
No more data