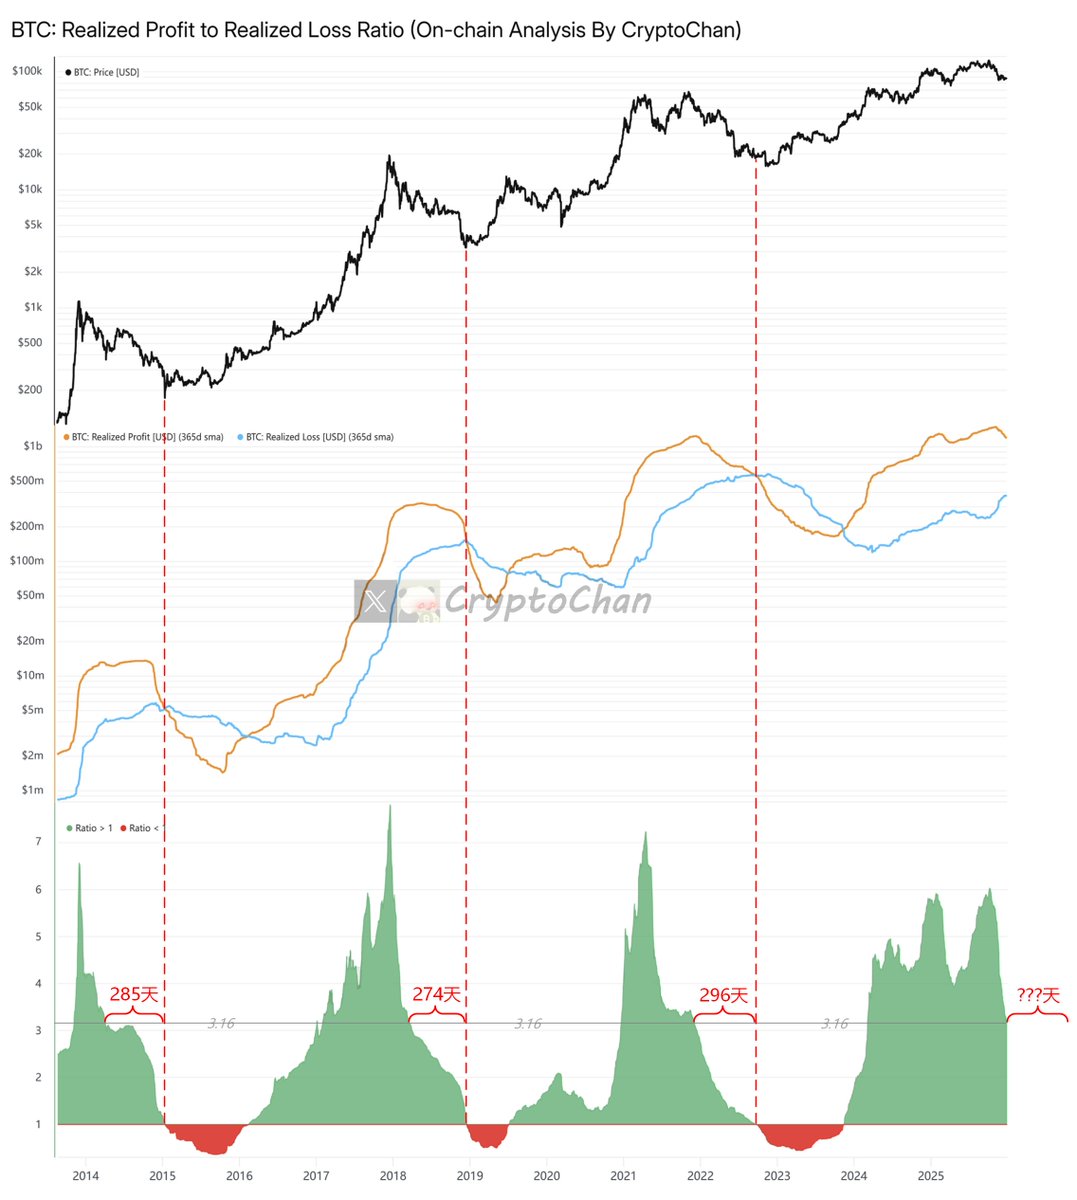
The indicator in the current chart has fallen to 3.16.
In 2014, it took 285 days for this indicator to fall from 3.16 to 1.
In 2018, it took 274 days.
In 2022, it took 296 days for this indicator to fall from 3.16 to 1.
The upper indicator in the chart is #BTC. Price;
The middle indicator in the chart represents Bitcoin's realized profits (365-day MA) and realized losses (365-day MA);
The lower indicator in the chart represents the ratio of Bitcoin's realized profits (365-day MA) to its realized losses (365-day MA), also known as the "realized profit/loss ratio (365-day MA)".
This ratio reflects the overall profit/loss status of market participants by comparing the moving average of the profits (the portion of the selling price higher than the purchase price) and losses (the portion of the selling price lower than the purchase price) realized by investors over the past 365 days.
In a bull market, the profit/loss ratio is typically higher because investors tend to take profits at higher prices.
In a bear market, the ratio is typically lower because investors may sell at a loss, reflecting market panic or capitulation.
Using a 365-day moving average smooths out short-term fluctuations and highlights long-term trends. This indicator is suitable for judging whether the market is overheated (overly high ratio) or excessively panicked (overly low ratio), and is a powerful tool for judging market cycles and trends.