Price Converter
  • Crypto
  • Fiat
USDUnited States Dollar
CNYChinese Yuan
JPYJapanese Yen
HKDHong Kong Dollar
THBThai Baht
GBPBritish Pound
EUREuro
AUDAustralian Dollar
TWDNew Taiwan Dollar
KRWSouth Korean Won
PHPPhilippine Peso
AEDUAE Dirham
CADCanadian Dollar
MYRMalaysian Ringgit
MOPMacanese Pataca
NZDNew Zealand Dollar
CHFSwiss Franc
CZKCzech Koruna
DKKDanish Krone
IDRIndonesian Rupiah
LKRSri Lankan Rupee
NOKNorwegian Krone
QARQatari Riyal
RUBRussian Ruble
SGDSingapore Dollar
SEKSwedish Krona
VNDVietnamese Dong
ZARSouth African Rand
No more data
menulogo
search
Index/List/Details
Sponge Evolution Theory
Crypto Newbie
1d ago
Follow
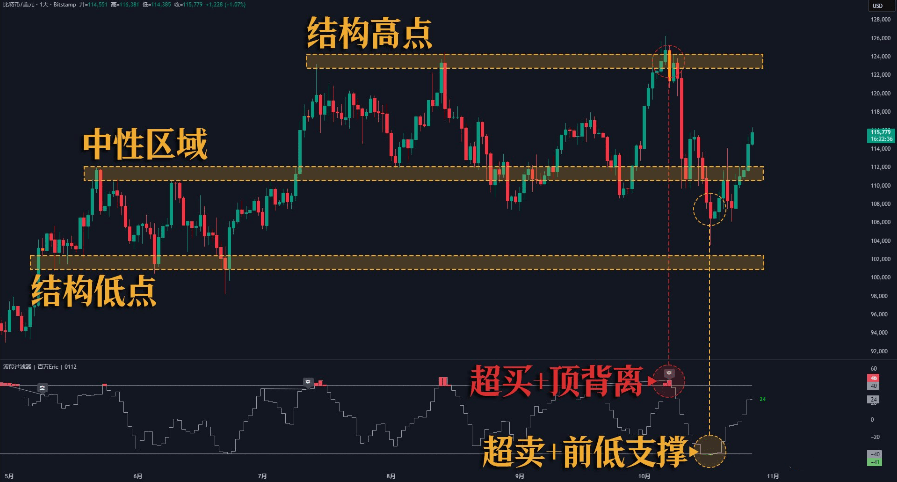
On the daily chart, Bitcoin's current highs and lows are roughly parallel, indicating a broad range of fluctuations. Further analysis using technical indicators reveals that the price has shown a high degree of respect for past overbought and oversold signals. Each time a signal is triggered, the price has experienced a periodic reversal, further confirming the validity of this oscillating pattern. Based on these two logical assumptions, Bitcoin is indeed currently experiencing a broad range of fluctuations, not a unilateral trend. The next key point is to observe when and where the next overbought signal will appear. If it coincides with a key resistance level, this presents a worthy opportunity to short the upper edge of the range.
Your browser does not support the video tag.
Icon主流货币技术探讨Icon比特币K线分析Icon比特币
BTC
-3.1%
Risk and Disclaimer:The content shared by the author represents only their personal views and does not reflect the position of CoinWorldNet (币界网). CoinWorldNet does not guarantee the truthfulness, accuracy, or originality of the content. This article does not constitute an offer, solicitation, invitation, recommendation, or advice to buy or sell any investment products or make any investment decisions
0
27
0
23
0
No Comments
edit
comment
collection27
like23
share