Is a correction about to begin? Read this and you'll understand!
Last night, ETH dipped again to around 3613. There's no sign of a stabilization stop, and technical support is weakening.
The daily chart shows several consecutive small bullish candlestick patterns, but volume continues to shrink, a typical sign of "stagflation," with few buyers.
The daily MACD remains in a death cross pattern, with shrinking red bars indicating a loss of upward momentum.
The RSI has fallen from overbought territory to below the 45 zone, significantly reducing bullish momentum.
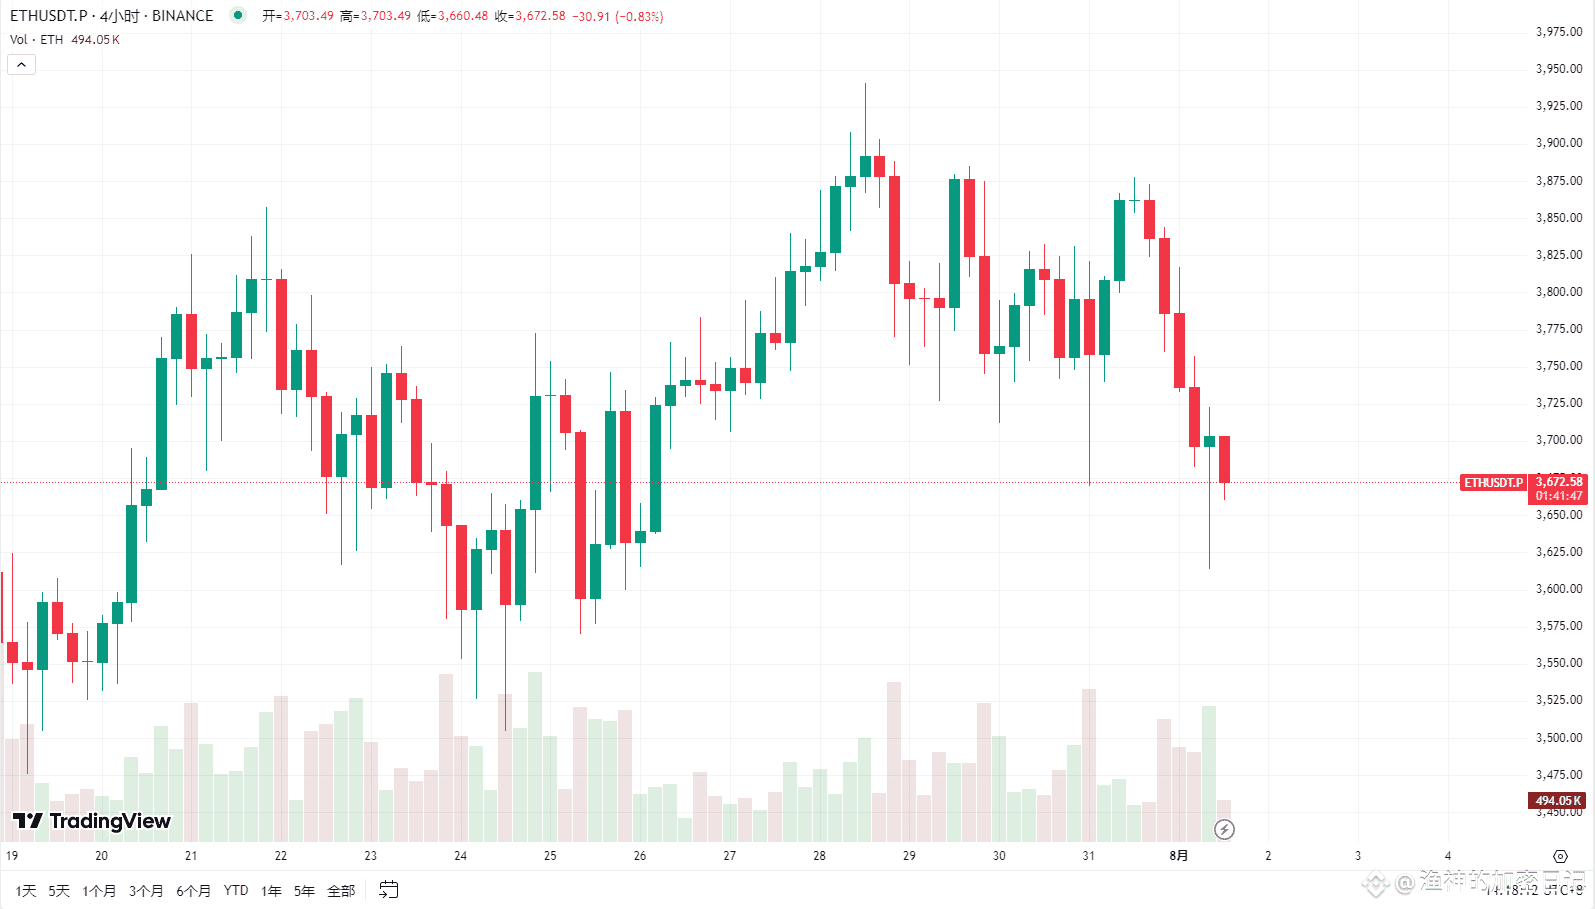
Actual Observation: The 4-hour chart has broken below the trendline. The central support at 3613 may hold, but a further break will trigger a downward trend.
Being bullish isn't difficult; monitoring the structure is more crucial. If the structure breaks, the uptrend may not be delayed, but the buildup will be slower.
The current trend is weak, and a pullback to a market correction is the main trendline. Short sellers can follow with a small position, while long sellers should wait for a clear stop to the decline.
The market is not short of opportunities, but you absolutely cannot afford to lose control or become overly optimistic. Slow down and you can survive longer.