#BTCUSDT
From a technical perspective, the 15-minute chart shows a potential false breakout above 8.92 (Fake Key level). A break below 8.67 would signal the end of this rebound.
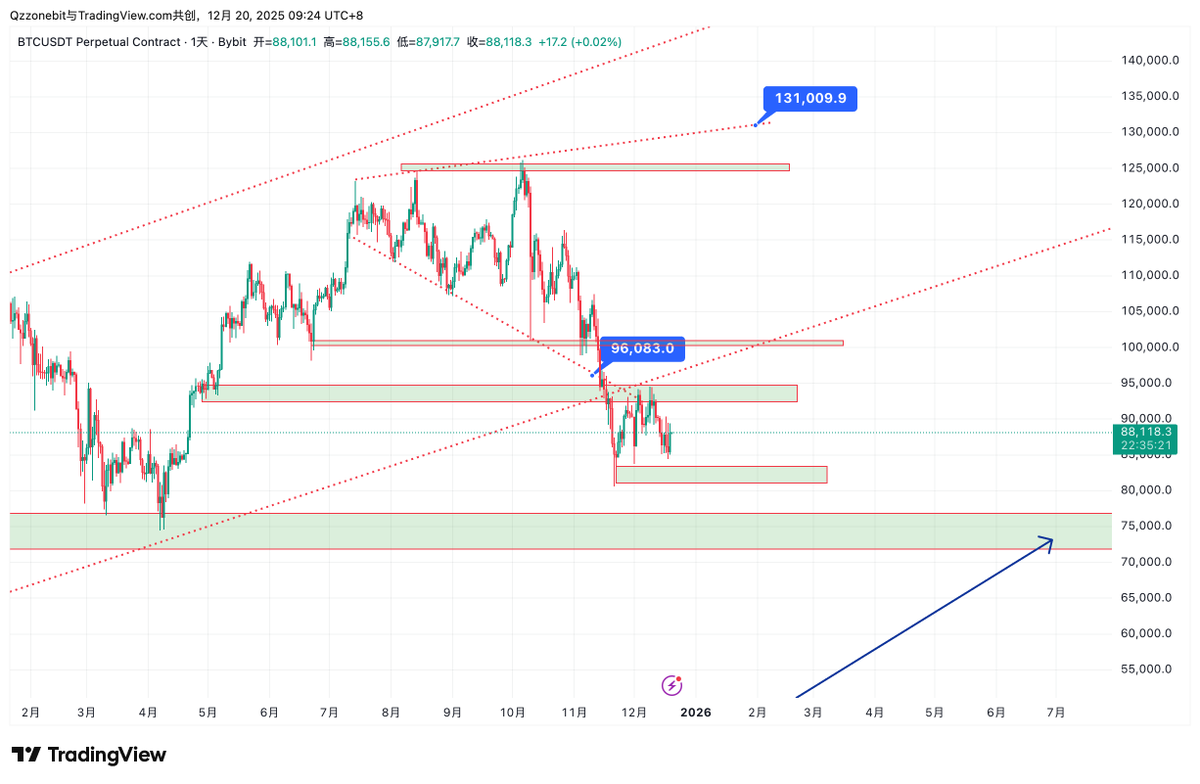
The daily chart view remains that 9.56 is the key level to watch for a potential strengthening move.
The key level on the 4-hour chart is 9.25.
Once the inflection points are identified, the direction of the market will depend on these levels. Volatility is expected to be low over the weekend.
Short at the current price, with a stop-loss at the previous high, or trade at the target level.
Trade on a rebound to 867. Consider entering a position after testing 852.