Market View
Our BTC chart and its implications
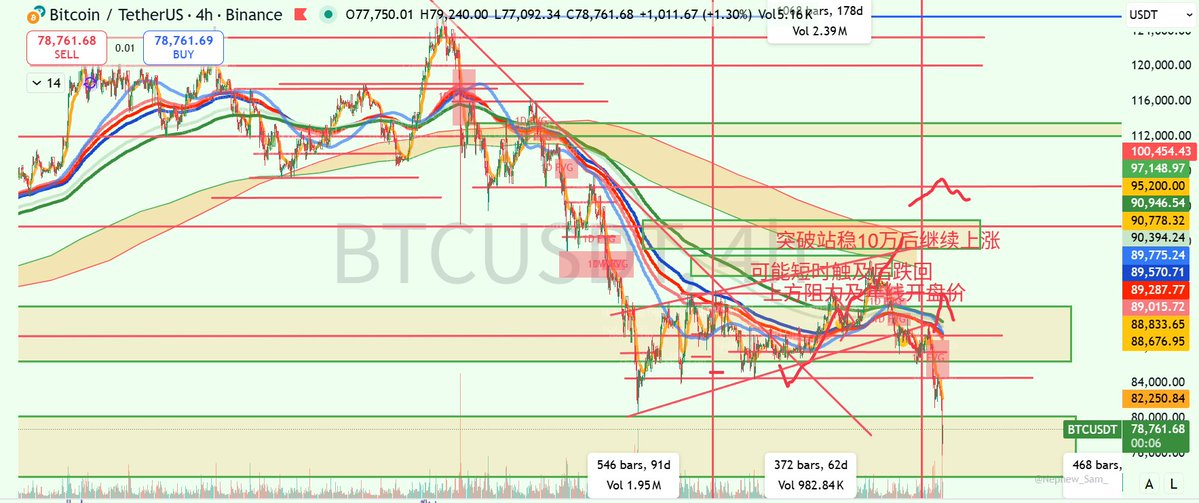
Our chart hasn't been modified since November. Currently, we can glean some information from the chart.
First, 93700 is the opening price of the 2025 yearly chart. This level acted as resistance throughout December until a breakout in January (2026).
96200-98600 is our "potential short-term touch followed by a pullback" range, which BTC has indeed touched and pulled back in.
A stable move above 100,000 followed by an upward move would be the best-case scenario, although that hasn't happened.
Currently, the price is within the lower yellow box (80200-73400). This range is the FVG formed in November 2024.
This range includes the important level of 73777 that we mentioned.
Therefore, I believe there's a high probability that this range will provide support. If this range provides support, the rebound should reach around 90,000.
After this rebound, I believe the price will continue to fall; if it continues to fall, the yellow box (80,200-73,400) is expected to fail, and the price will continue to fall below 58,000.
This article is sponsored by #BCGAME|@bcgame @bcgamecoin