🌿Midday Market Commentary, January 16th.🌿
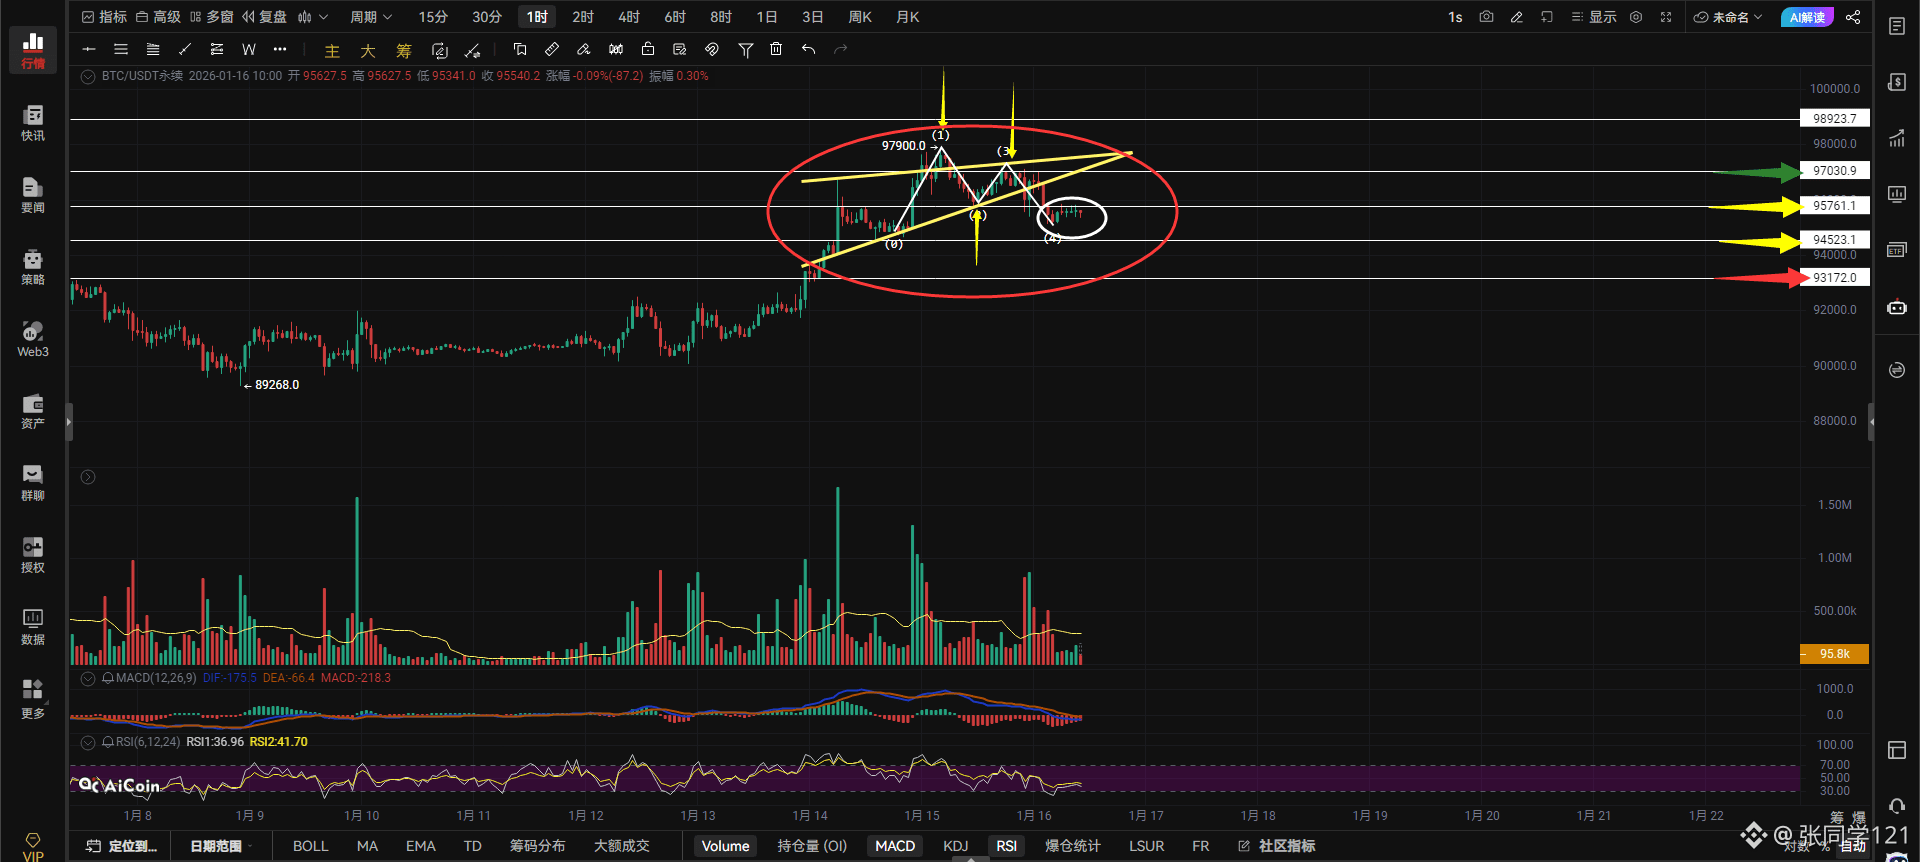
BTC Commentary: Bitcoin failed its second attempt to break 98,000, failing to even surpass the previous high indicated by the yellow arrow.
Currently, Bitcoin's highs and lows are both decreasing, which is not a good sign. Furthermore, the triangle pattern has been broken, and a new Ⓜ️top pattern has formed within the triangle, with the neckline also broken.
The hourly Ⓜ️top pattern is now established.
Looking at the area circled in white, Bitcoin is forming a barbed wire pattern. What is a barbed wire pattern? It means Bitcoin is in a narrow range and is about to choose a direction. If Bitcoin can return above 95,761, the current downward trend will stop, and it will continue to consolidate around 97,030-95,761.
If it cannot return above 95,761 and remains below 95,761 for an extended period, it will definitely retrace to the support level of 94,523.
If 94523 can't hold, then 93172 will follow. 93172 is the last line of defense for this bullish trend. If it fails to hold, the bullish trend circled in red will temporarily end, and a sharp drop will follow. Remember what I wrote in yesterday's post?
If the second attempt to break through 98000 fails, a pullback is inevitable. If it fails to break through 95761, it's over.
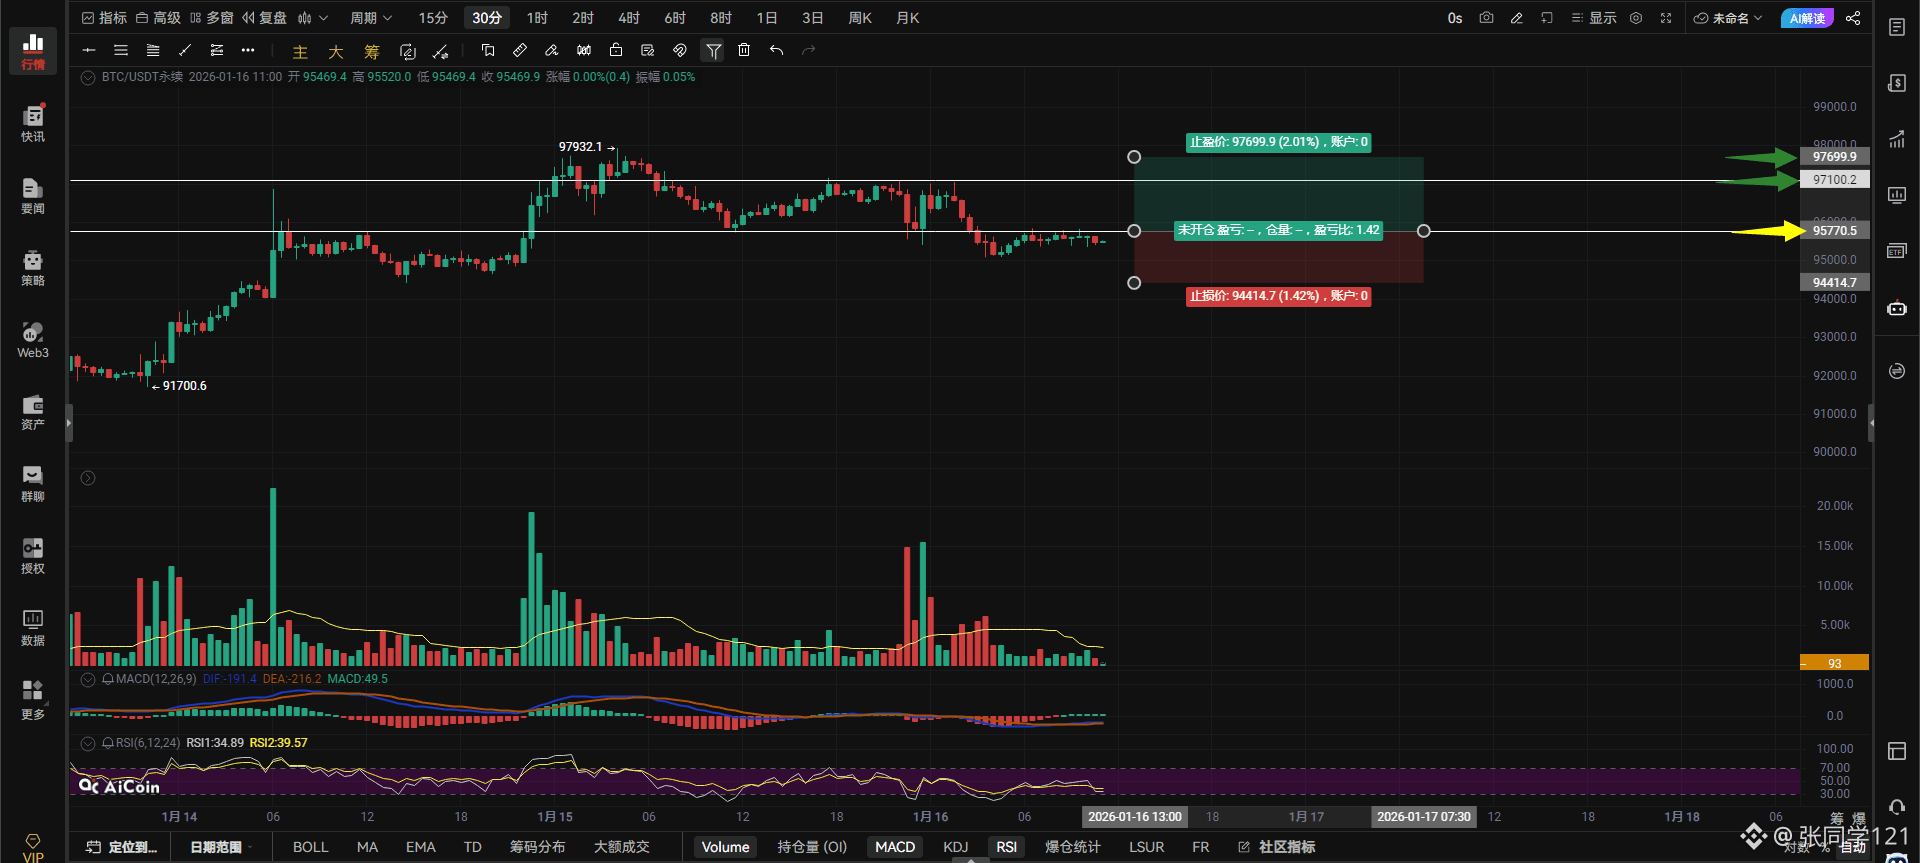
If Bitcoin breaks through 95761 with volume, go long on the right side. On a rebound to 97030, take a small short position. Stop loss if it breaks through 98000 and makes a new high.
If Bitcoin breaks and holds above 95761 on the hourly chart, look towards 97030-98068. If it fails to break through 95761, the upward movement will be limited.
If Bitcoin breaks below 95101 on the 4-hour chart, look towards 94521-93048.
Upper resistance: 95761-97030-98068
Lower support: 95101-94521-93048
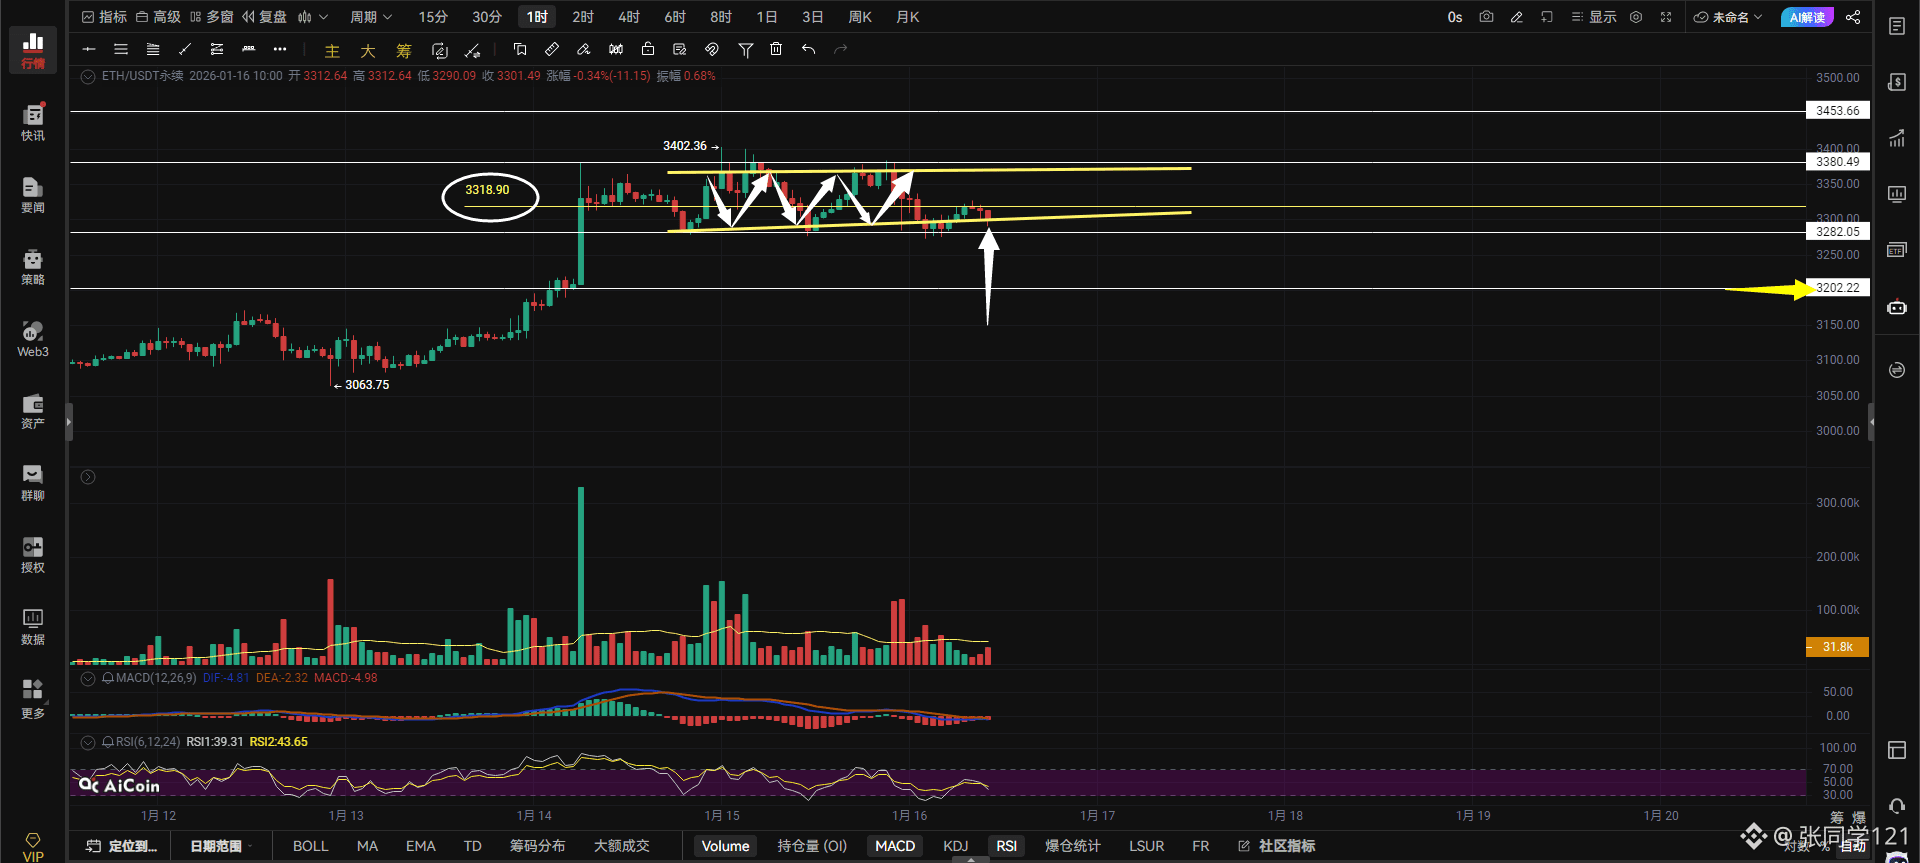
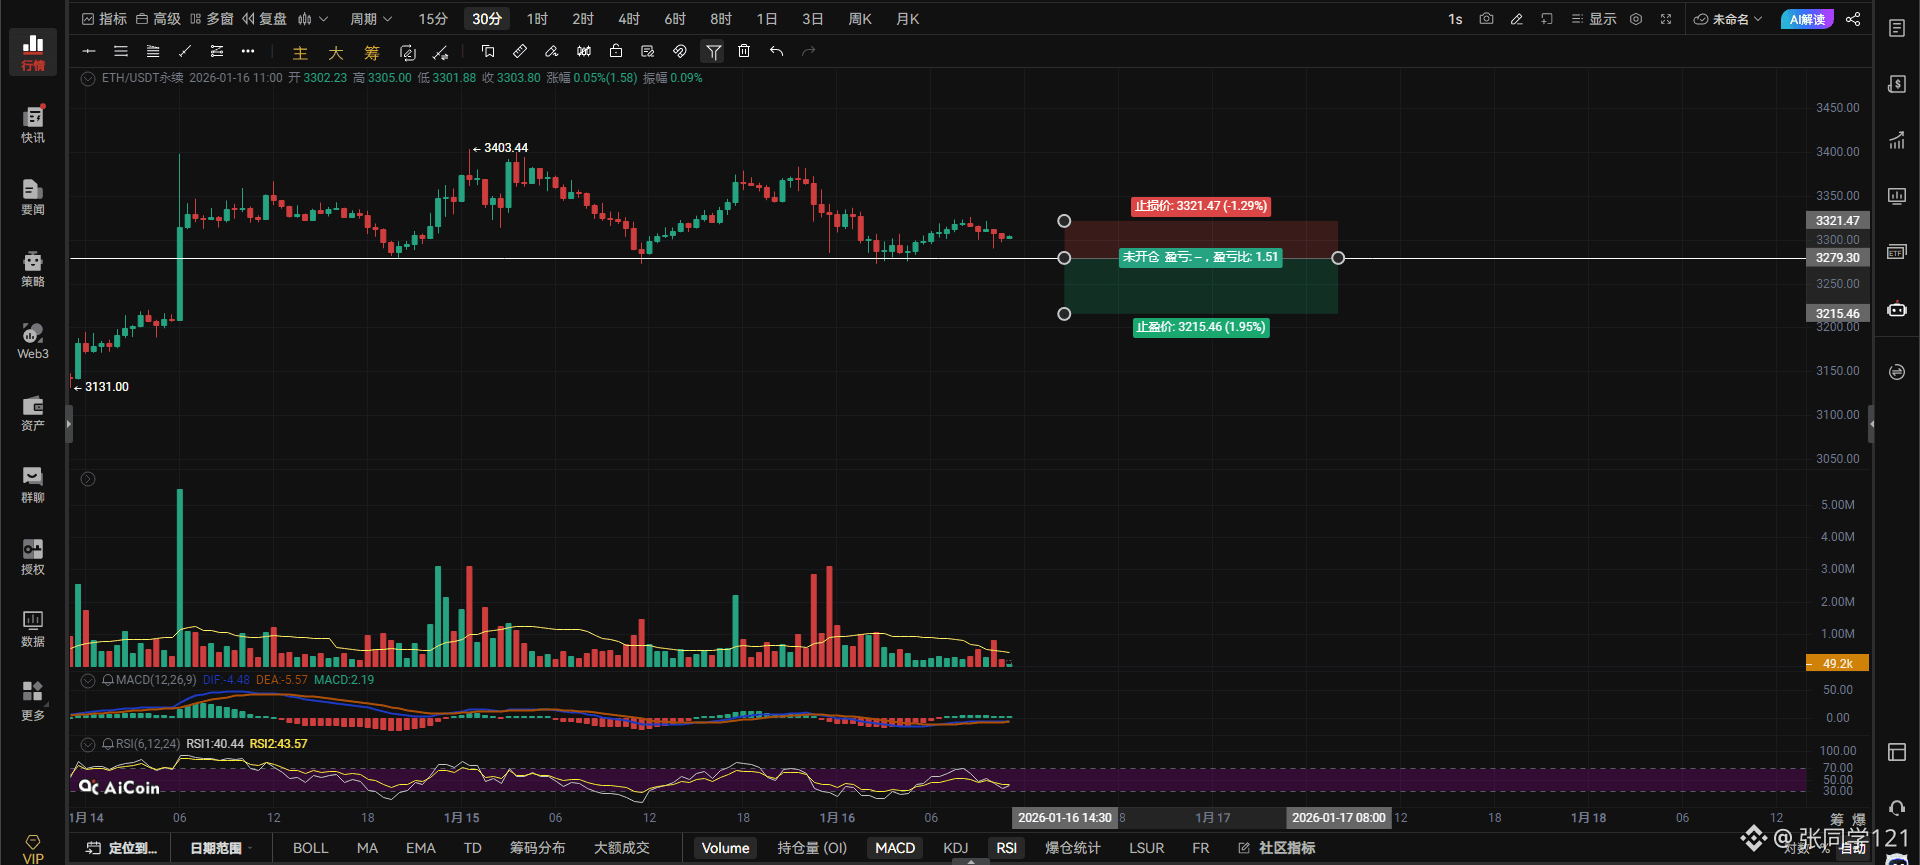
ETH Strategy: Buy BTC if it breaks through 3317 with volume, with a stop-loss order placed.
Sell BTC if it breaks below 3278 with volume, with a stop-loss order placed.
Buy BTC on a pullback to 3206 if support holds, with a stop-loss order placed below 3170.
If BTC holds above 3317 on the hourly chart, target 3358-3381.
Sell BTC on a break above 3381, with a stop-loss order placed below 3416.
Left-side spike order: Buy at 3164, with a stop-loss order placed below 3129.
Resistance levels: 3317-3358-3381
Support levels: 3276-3228-3187
On the 4-hour chart, a break below 3279 would target 3230-3173. Bitcoin's price action has been stable, oscillating within a wedge pattern. Hopefully, this oscillation will continue. A break below 3202, though seemingly far, is inevitable. For an upward move, a break above 3318 is necessary; otherwise, the meeting is adjourned.
$BTC
#US Core CPI Lower Than Expected
{future}(BTCUSDT)
{future}(ETHUSDT)