😲Midday Market Commentary, January 15th. 😲
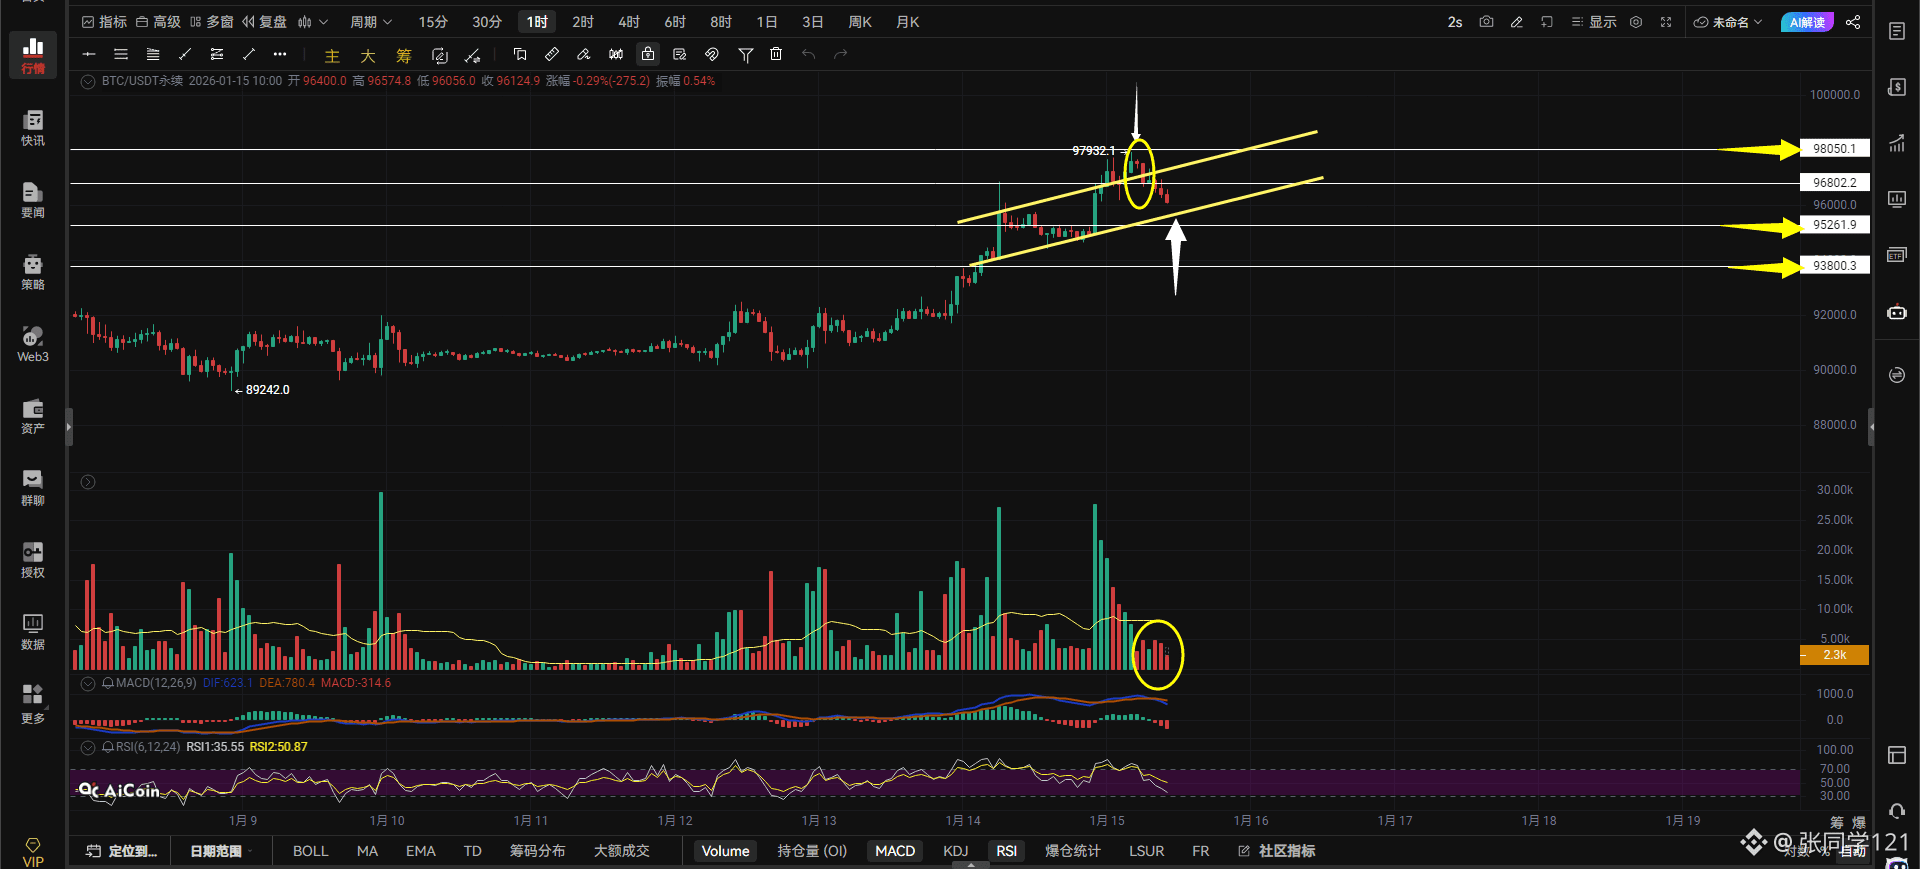
BTC Commentary: Woke up to another new high – applause, please! However, it's a bit of a shame it missed the 98,000 psychological barrier by just a few dozen dollars. The current pullback due to the strong resistance at 98,000 is a normal correction.
Don't worry, everyone. The 98,000 resistance level will either not be broken, or it will break through, indicating a reversal on the daily chart. This drop to 80,000 started from 98,000. If it holds above 98,000 on the daily chart, you'll soon see Bitcoin reach 100,000.
Bitcoin formed an evening star pattern after a false breakout from a bearish flag pattern, indicating a potential pullback. Even if Bitcoin rose from 90,000 to 98,000, a pullback of $3,000 is normal. Don't expect it to jump to 110,000-120,000 in one go after opening a long position; even if it could, it wouldn't happen in a day. Looking at the volume circled in yellow below, although there's a pullback, the volume isn't high, indicating a low-volume pullback phase.
A low-volume pullback won't be too deep. As long as the pullback doesn't break the flag pattern's 95,572-95,261 level, it won't retest 93,800. It will consolidate within the flag pattern and then challenge 98,000 again. Since this is the first challenge of 98,000, there will be a second chance. If it fails to break through 98,000 on the second attempt, be cautious. A failed first attempt is understandable, but a failed second attempt will likely lead to a deeper pullback.
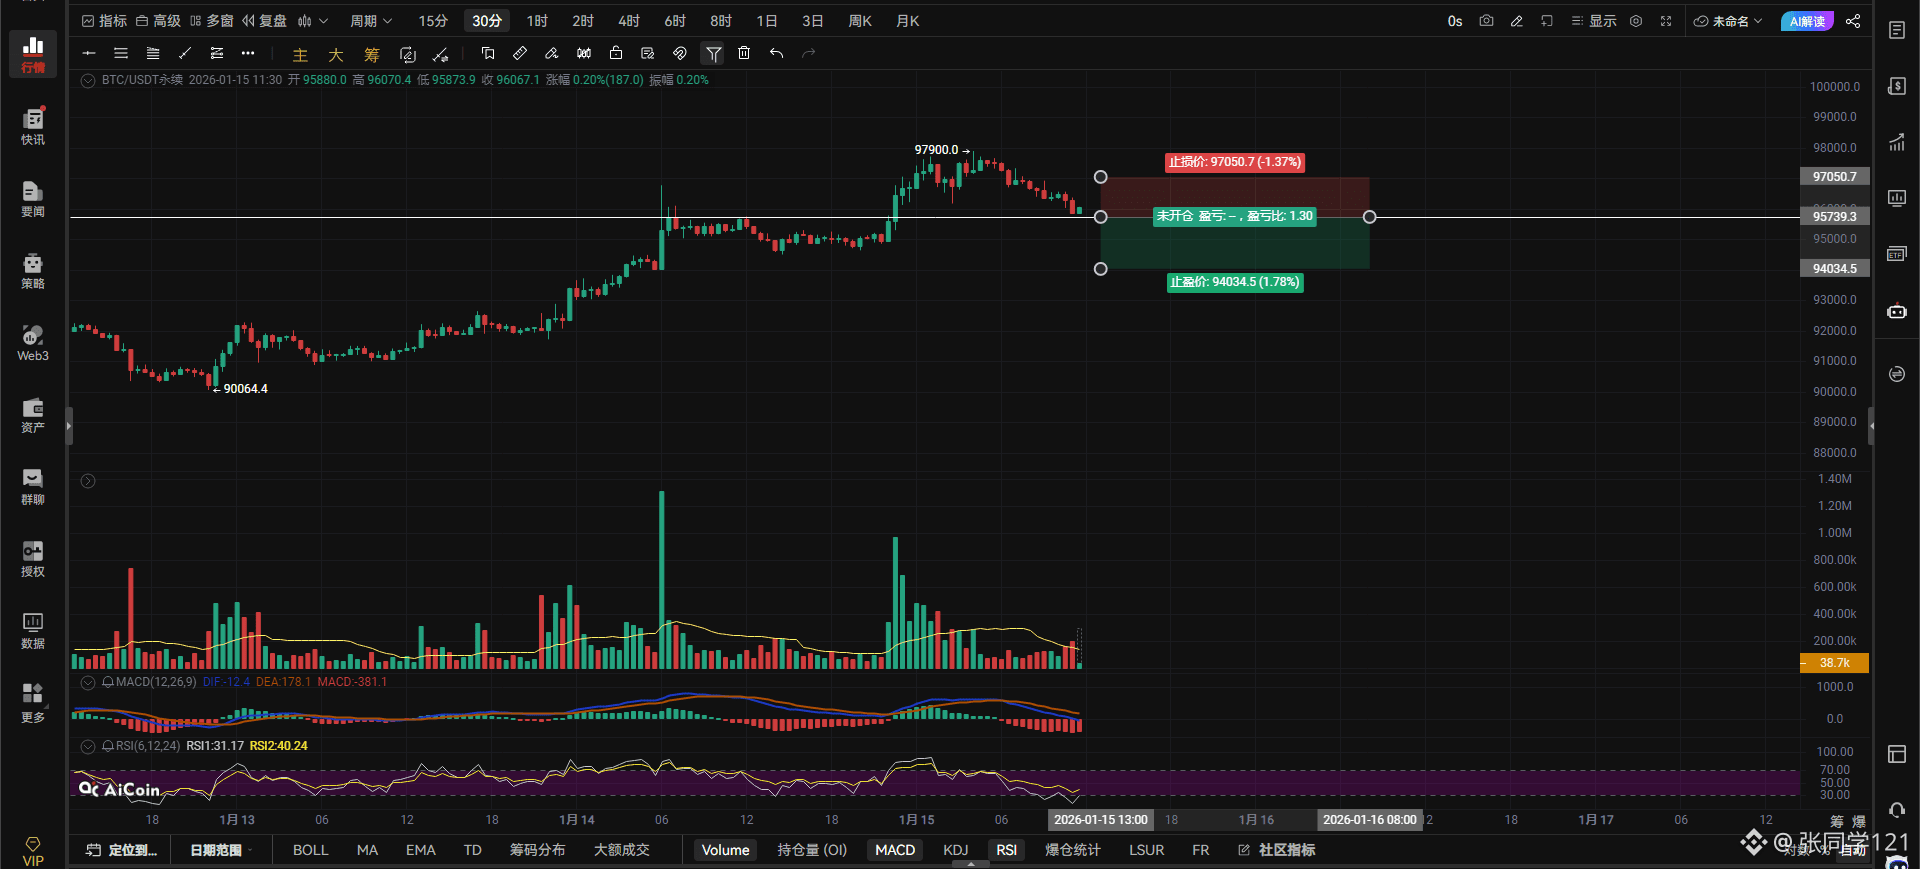
Bitcoin (BTC) broke through 96917 with volume, indicating a potential long position. A break below 95753 with volume followed by a failed rebound suggests a short position, with a stop-loss order in place.
If Bitcoin breaks and holds above 96917 on the hourly chart, the upside targets are 98050-99292. A break above 96917 is necessary for further upward movement.
A break below 96126 on the 4-hour chart targets 94655-93557.
Resistance levels: 96917-98050-99292
Support levels: 95572-94408-93801
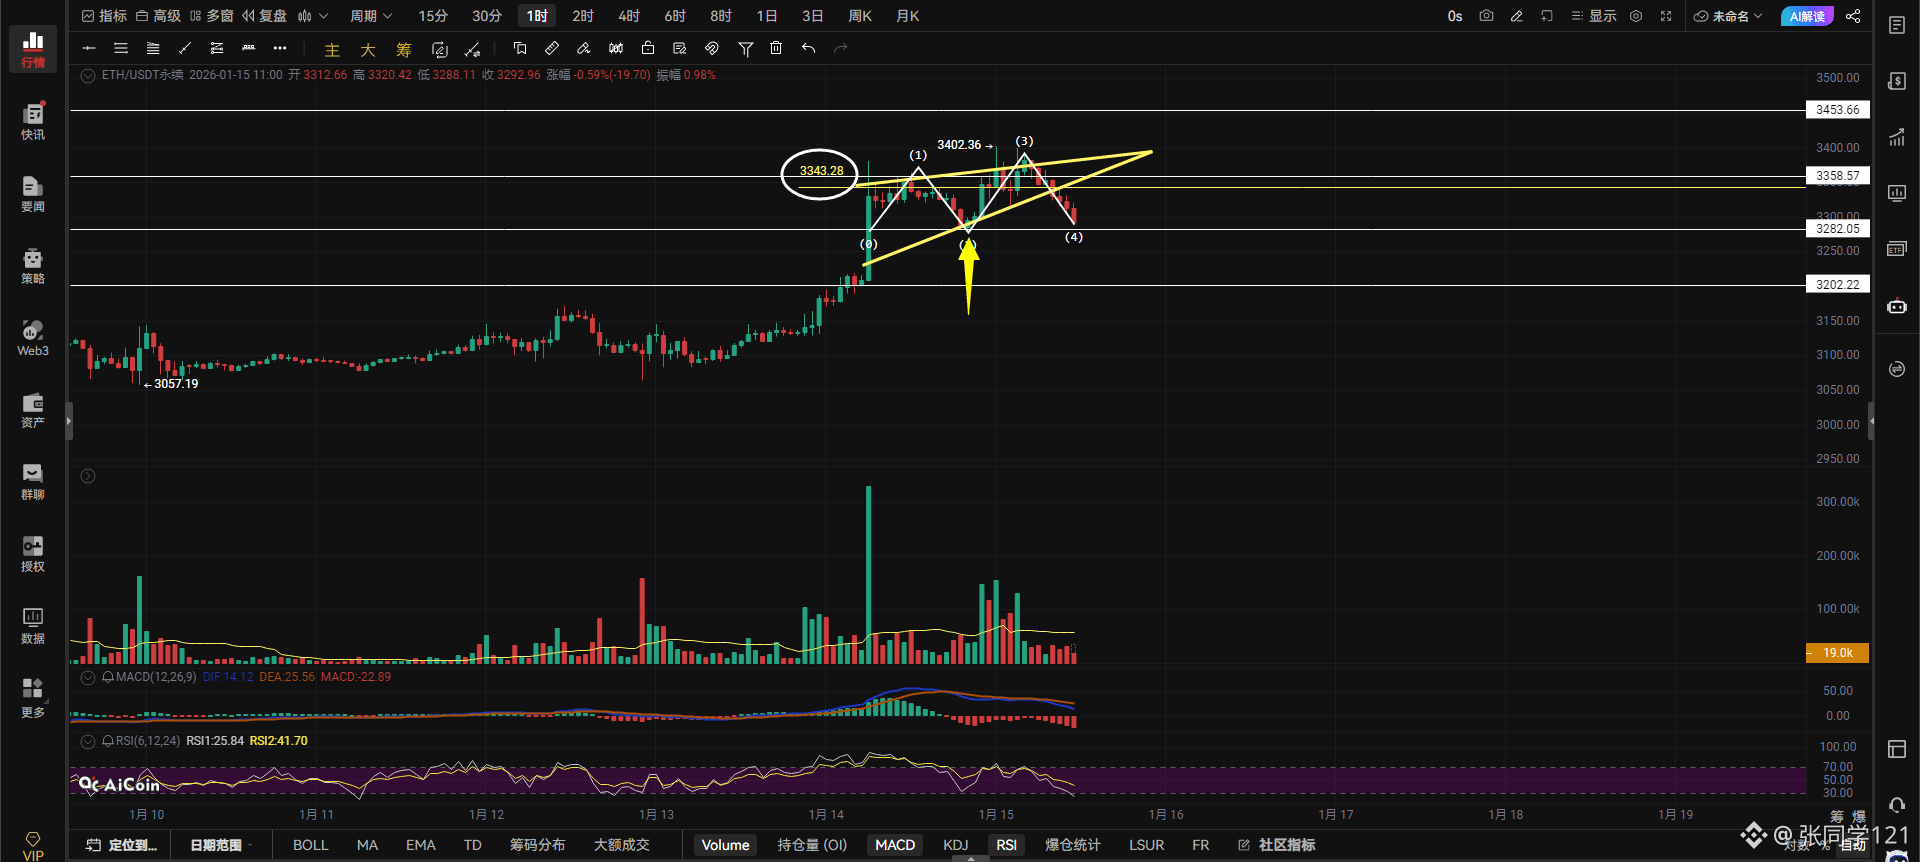
ETH Strategy: Bitcoin (BTC) broke through 3341 with volume, indicating a long position, with a stop-loss order placed.
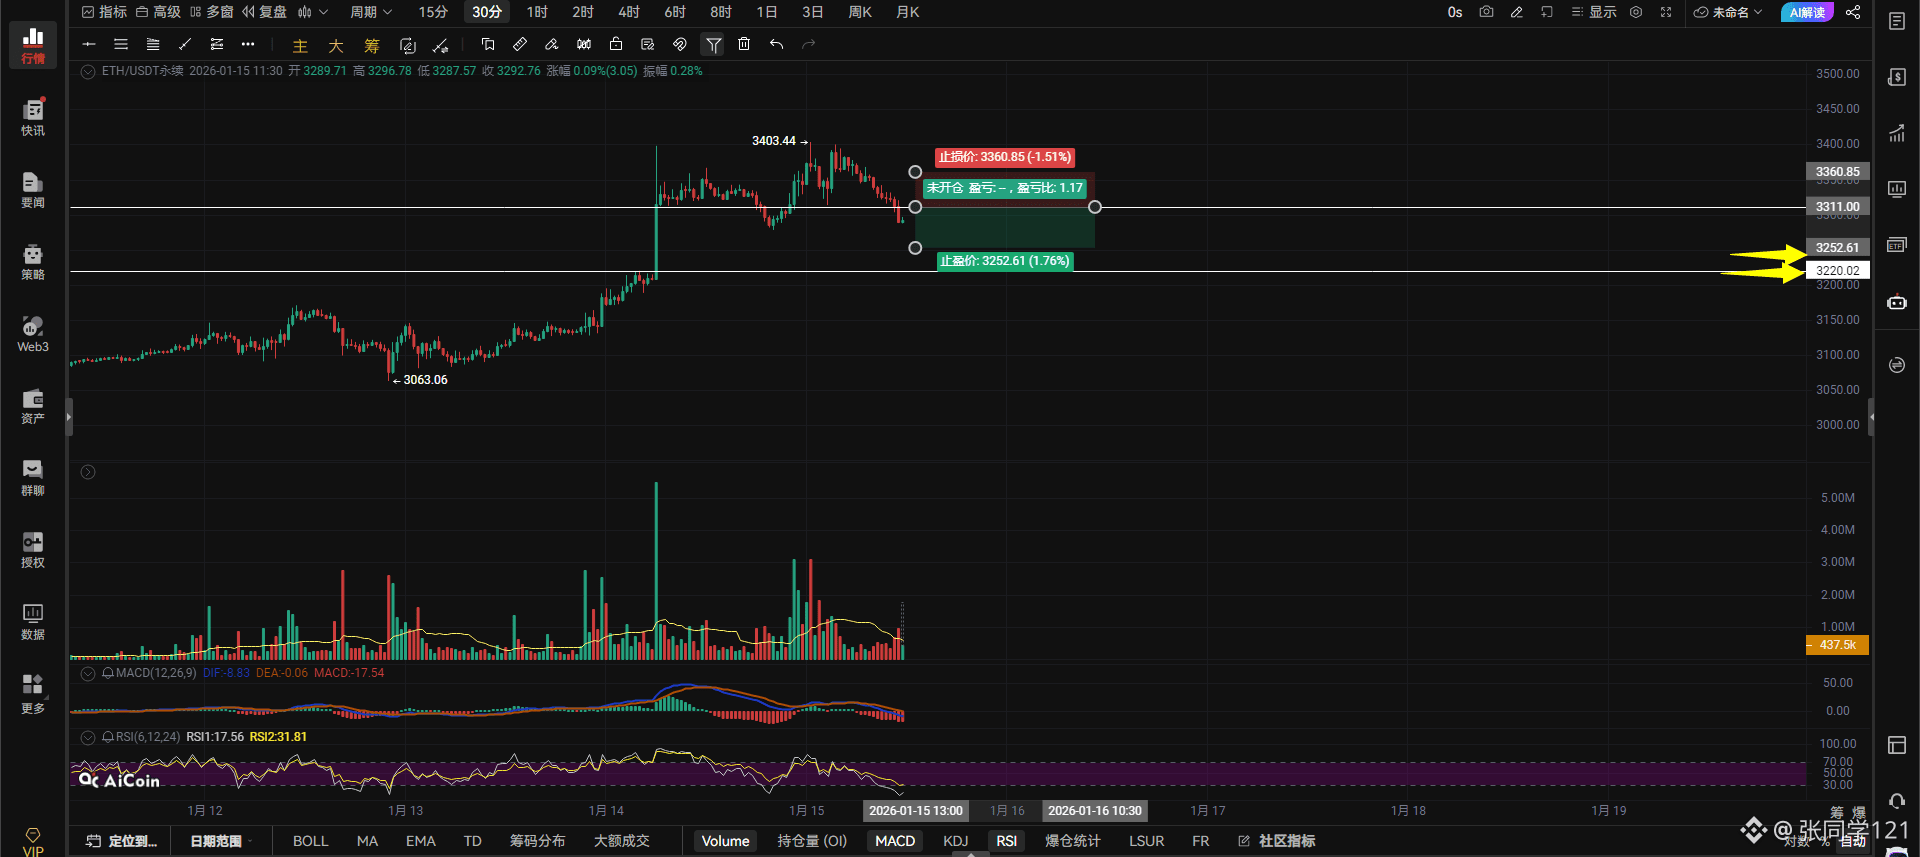
A break below 3310 with volume suggests a short position, with a stop-loss order in place.
A pullback to 3223 confirming support suggests a long position, with a stop-loss order placed below 3183.
If Bitcoin (BTC) holds above 3341 on the hourly chart, the upside targets are 3379-3453.
Watch for a short position at 3403, with a stop-loss at 3453.
Left-side buy order: 3148, stop-loss at 3103.
Upside resistance: 3341-3379-3453
Downside support: 3312-3281-3221.
A break below 3309 on the 4-hour chart would target 3271-3221.
See comments section.
$BTC
#StrategyIncreasesBitcoinHoldings
{future}(BTCUSDT)
{future}(ETHUSDT)