$BTC Evening Commentary: Looking at the chart: After Bitcoin broke below the 109660 support level, the next candlestick immediately rebounded above 109660. This is a typical false breakout. False breakouts are usually followed by genuine breakouts, but this false breakout didn't break through, and it didn't even hold above the 111535 resistance level. This rapid recovery after the false breakout can be interpreted as a natural rebound after the decline, meaning short covering caused the price to bounce. Notice the low volume (circled in white below) despite the significant price increase; this further confirms that this rebound was caused by short profit-taking. Therefore, I believe there's a possibility of a second test of the lower lows unless it can hold above the 111535 resistance level. Otherwise, a second test of the lower lows is only a matter of time, and it might even test 107445. Ideally, it shouldn't break below the 109660 support level again, and instead consolidate around 111535-109660 as a consolidation phase after the decline.
Otherwise, a further drop below 109660 could trigger panic among retail investors, causing prices to fall even deeper.
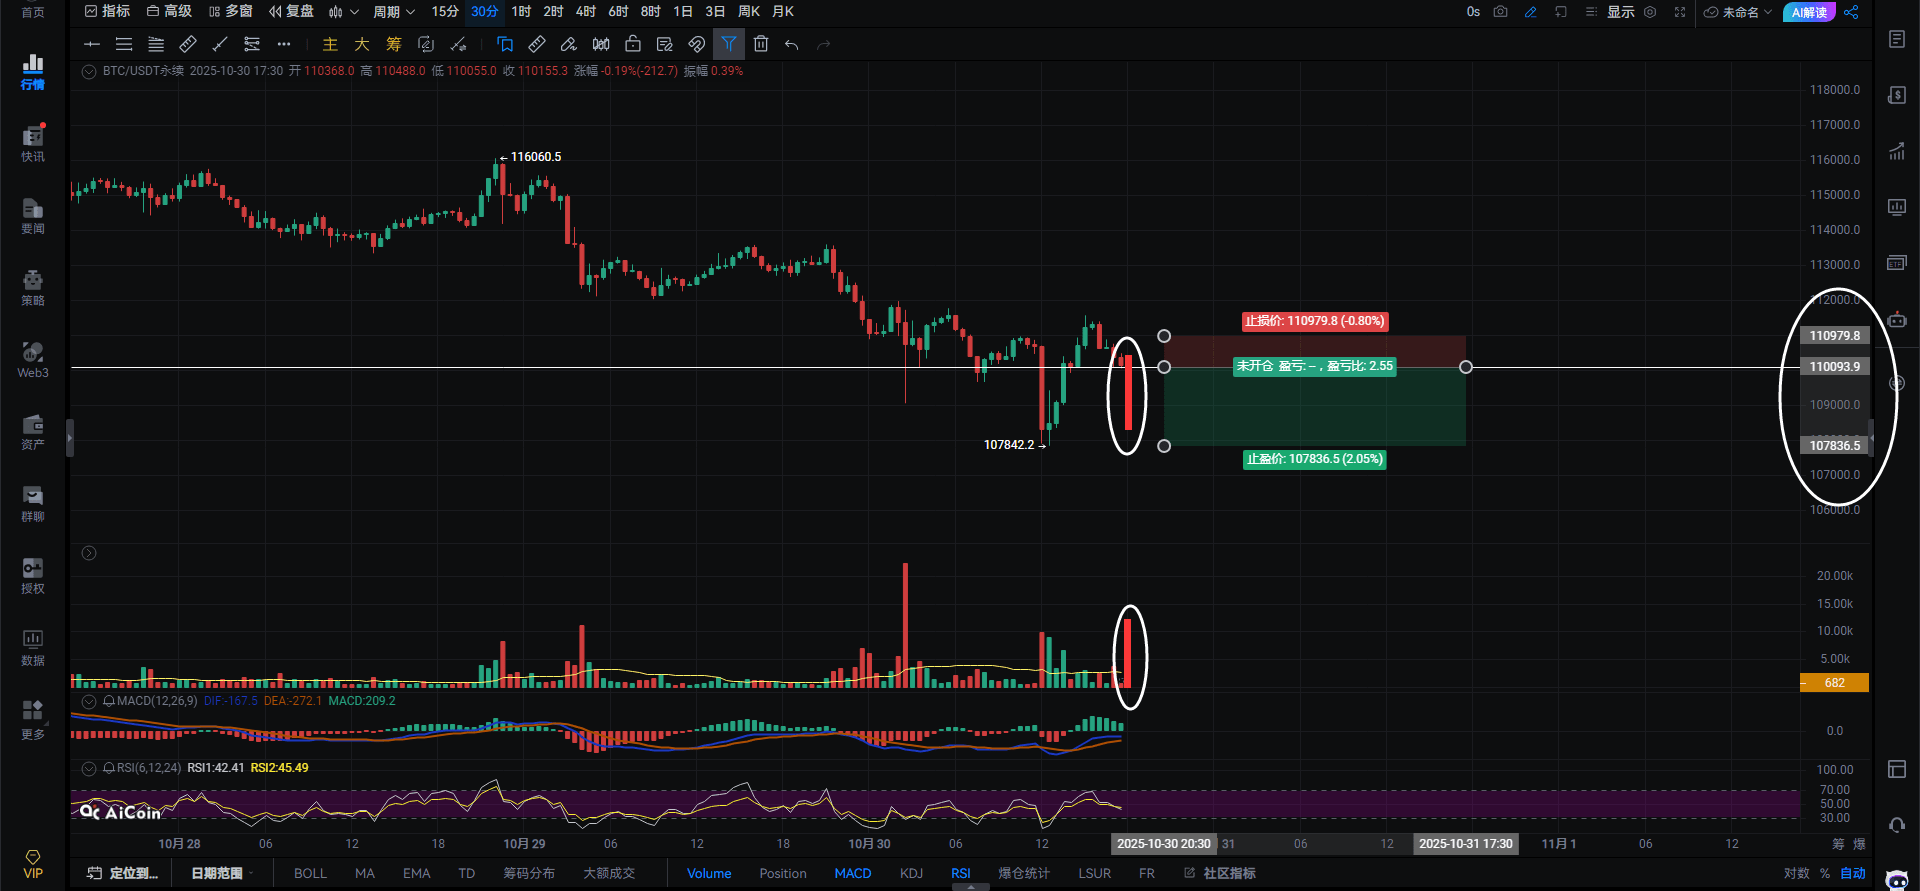
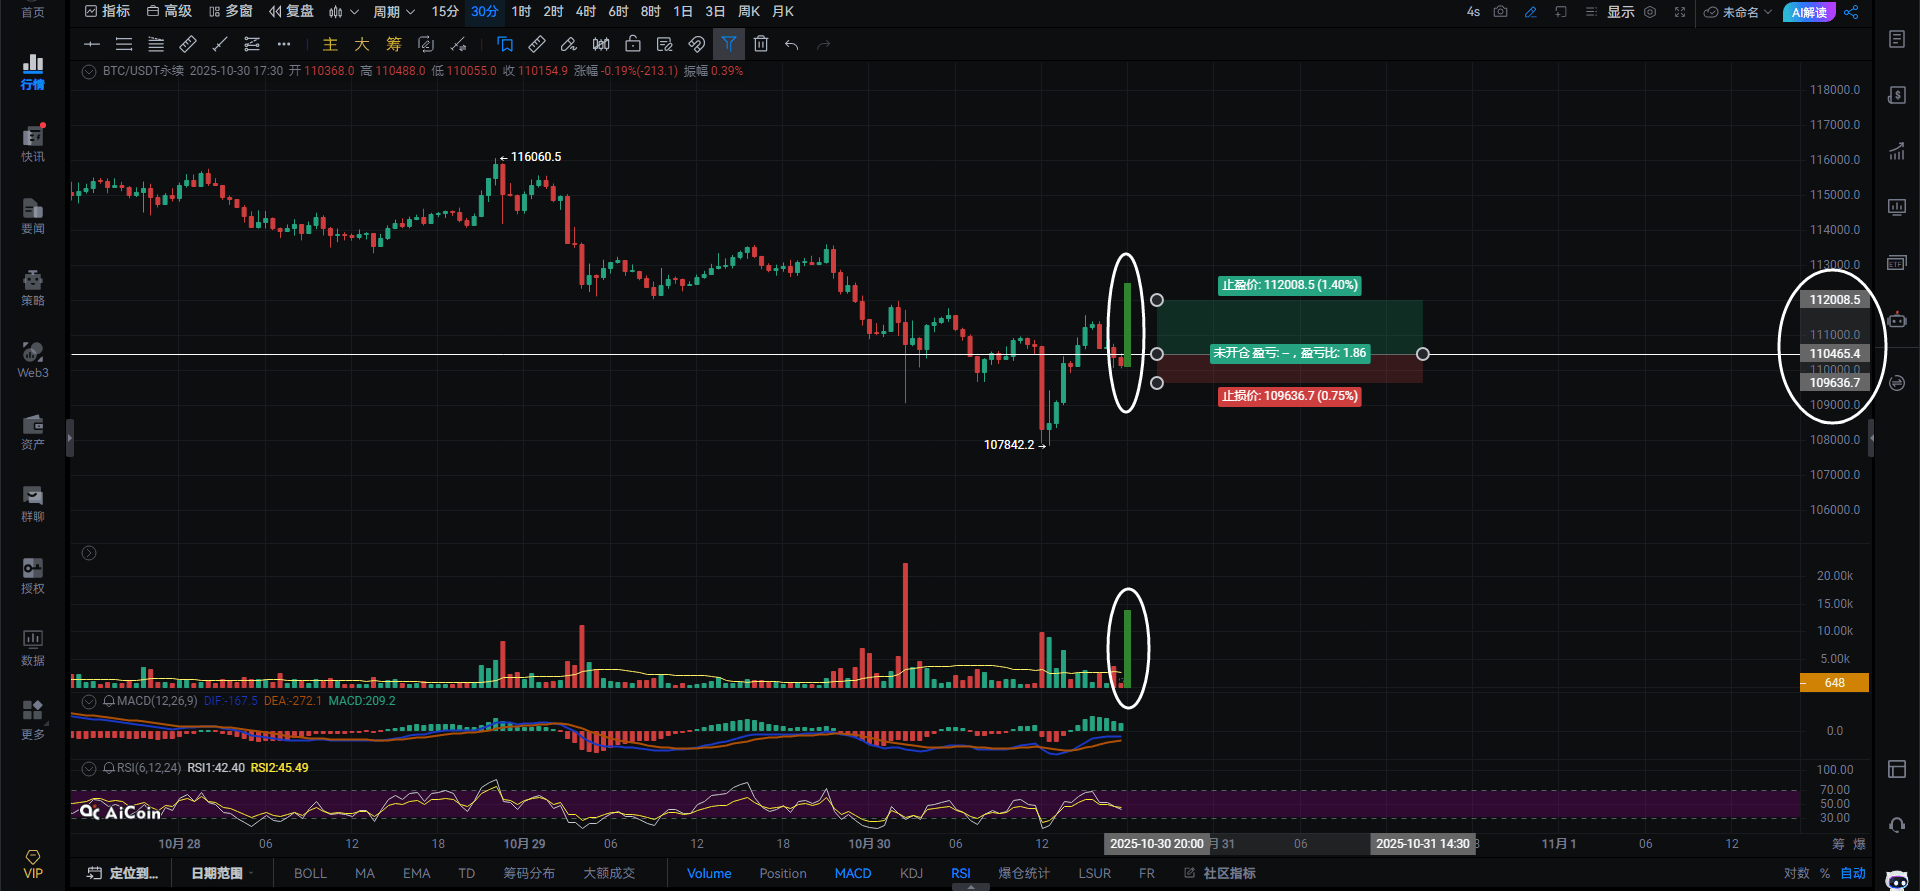
🍆 Bitcoin broke through 110465 with volume, suggesting a long position to capitalize on the rebound. A break below 110093 with volume followed by a failed rebound suggests a short position to capitalize on the pullback, with a stop-loss order in place.
If Bitcoin breaks and holds above 110780 on the hourly chart, the upside target is 111583-112566. A failure to break above 111583 is insufficient.
If Bitcoin breaks below 109660 on the 4-hour chart, the downside target is 107389-106187. A break below 106187 would temporarily halt this upward trend.
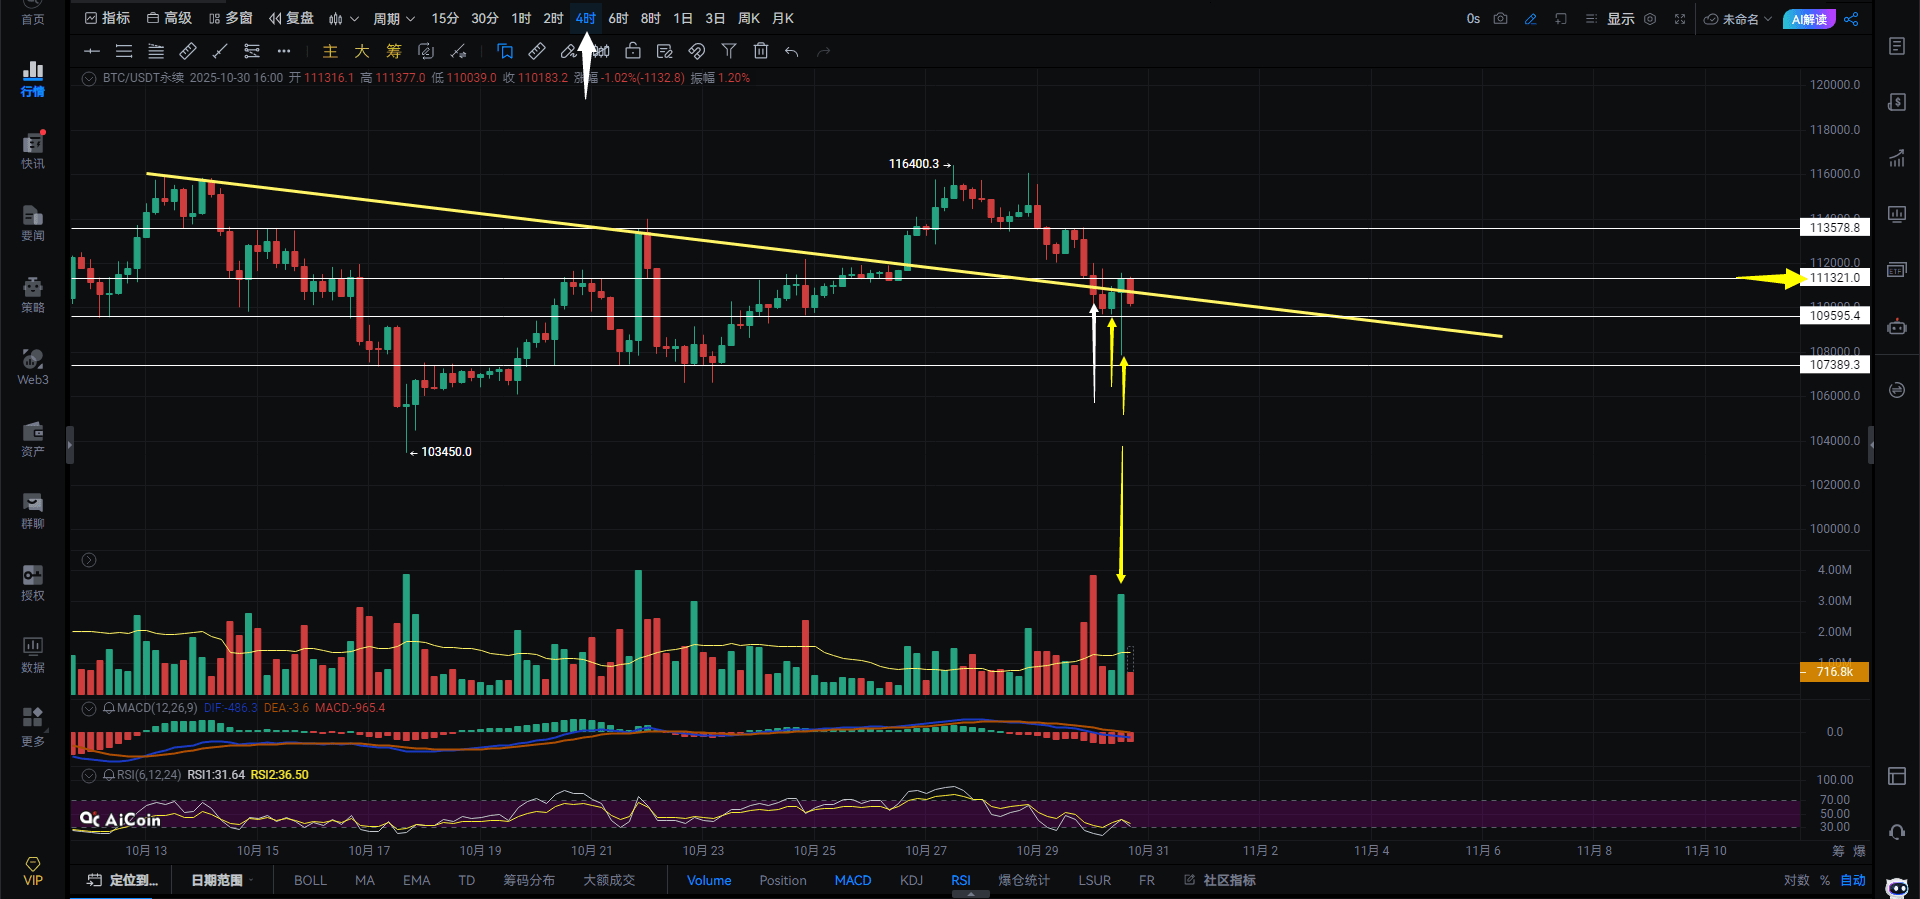
🍆 Continuing with the chart: On the 4-hour chart for Bitcoin, if your long positions at the bottom were broken below this yellow trend line, you should have exited. If you didn't exit after the break and were waiting for a rebound, you should have exited between the two candlesticks indicated by the yellow arrows, because the rebound has already been given to you. If you don't exit now, you might miss your chance unless you're holding a long-term position and don't care about short-term fluctuations. For short-term traders, the two candlesticks indicated by the yellow arrows are giving you an opportunity to exit. Look at the volume corresponding to the candlesticks indicated by the yellow arrows below—is this a strong indication? Huge volume, but the price only rose slightly, and now it's fallen back below the yellow trend line. Since you don't want to exit, then don't. If it retraces to today's low and shows a false break and then recovers, you can take a small long position on the left side. If there's no false break and recovery, don't take any. You can also take a small initial position in the spot market around 107389. Meeting adjourned.
$BTC
#Fed Rate Cut
{future}(BTCUSDT)