Price Converter
  • Crypto
  • Fiat
USDUnited States Dollar
CNYChinese Yuan
JPYJapanese Yen
HKDHong Kong Dollar
THBThai Baht
GBPBritish Pound
EUREuro
AUDAustralian Dollar
TWDNew Taiwan Dollar
KRWSouth Korean Won
PHPPhilippine Peso
AEDUAE Dirham
CADCanadian Dollar
MYRMalaysian Ringgit
MOPMacanese Pataca
NZDNew Zealand Dollar
CHFSwiss Franc
CZKCzech Koruna
DKKDanish Krone
IDRIndonesian Rupiah
LKRSri Lankan Rupee
NOKNorwegian Krone
QARQatari Riyal
RUBRussian Ruble
SGDSingapore Dollar
SEKSwedish Krona
VNDVietnamese Dong
ZARSouth African Rand
No more data
menulogo
search
Index/List/Details
TheKingfisher
Infra
09-13 04:09
Follow
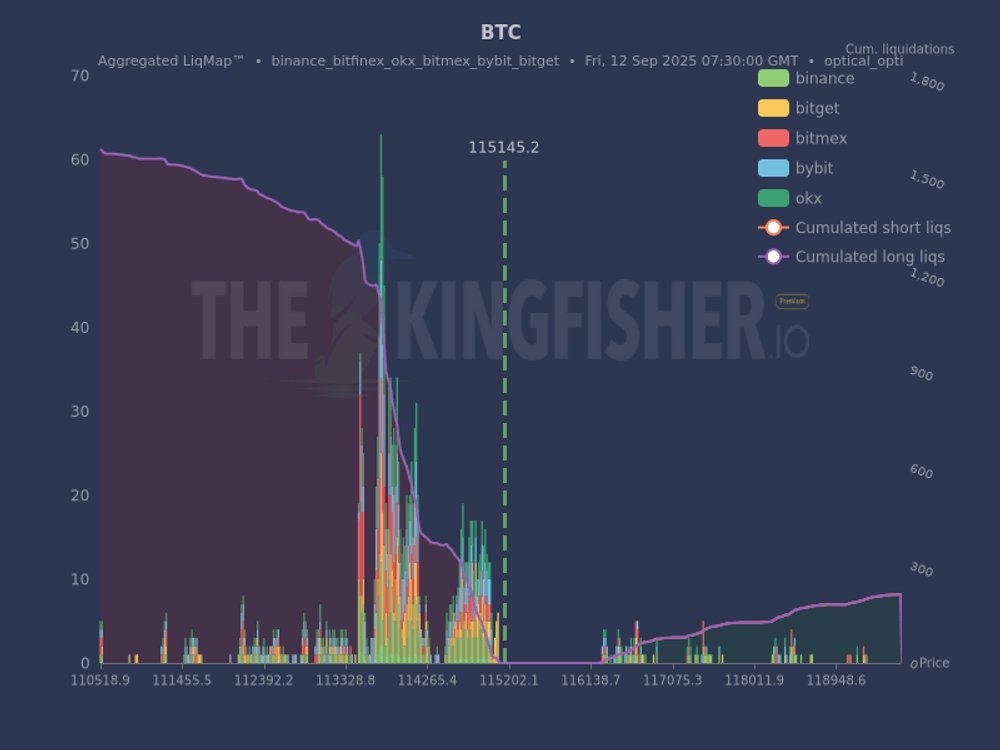
Here's the key point of this BTC liquidation chart. That green line? That's the current price. See those large red and orange bars on the left? Those are long liquidations at the current price. Smart investors are watching these levels. The line on the right is short liquidations, but they're much smaller. This means most of the pain is currently concentrated on the long side. This is a shorter timeframe chart, called "optical_opti," which typically clears within a few days. This chart shows where traders are overleveraged. It's a pain chart. Price tends to get sucked into these areas to liquidate positions. Use this data so you don't get disadvantaged by large swings. Most traders will panic. You can predict that. $BTC
Your browser does not support the video tag.
Icon杠杆Icon比特币K线分析Icon比特币
BTC
+1.06%
Risk and Disclaimer:The content shared by the author represents only their personal views and does not reflect the position of CoinWorldNet (币界网). CoinWorldNet does not guarantee the truthfulness, accuracy, or originality of the content. This article does not constitute an offer, solicitation, invitation, recommendation, or advice to buy or sell any investment products or make any investment decisions
0
47
0
34
0
No Comments
edit
comment
collection47
like34
share