🚀August 1st Midday Market View. 🚀
$BTC View:
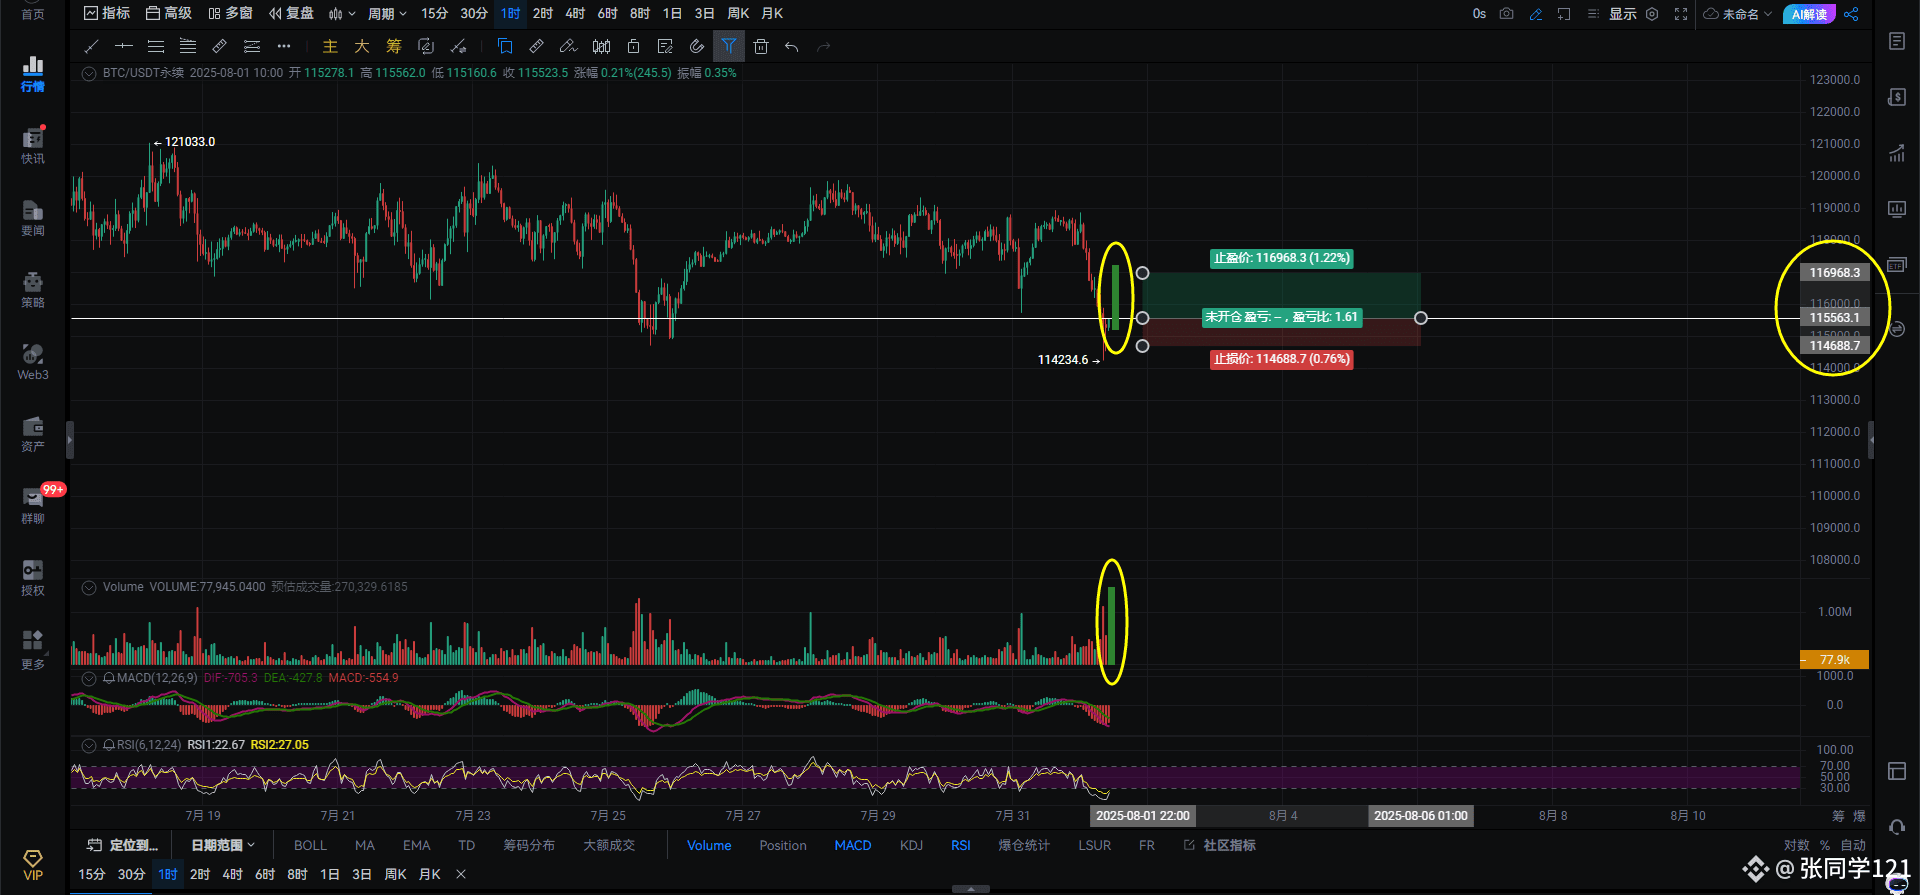
If Bitcoin breaks through 115539 on a high volume and closes above 115539 on the hourly chart, buy on the right side to take advantage of the rebound, and stop loss if it breaks through.
If Bitcoin breaks below 114549 on a high volume and the rebound fails to recover, buy on the right side and recover with a stop loss. Pay attention to volume changes and set a stop loss.
If there is a false breakout at 113808, buy one lot with a small position. Stop loss at the low of the false breakout or below 112929. If it fails to recover, don't buy more.
🚀
If Bitcoin stabilizes at 115798 on the hourly chart, look for upward movement between 116474 and 117102. If it fails to recover at 117102, further declines are likely.
If Bitcoin shorts, watch for a false breakout at 117102 on the 2B chart, buy one lot with a small position, and stop loss at 118357 if it breaks through and recovers. Conservative investors, etc.: Buy at 112089, stop loss at 110846 if it falls below.
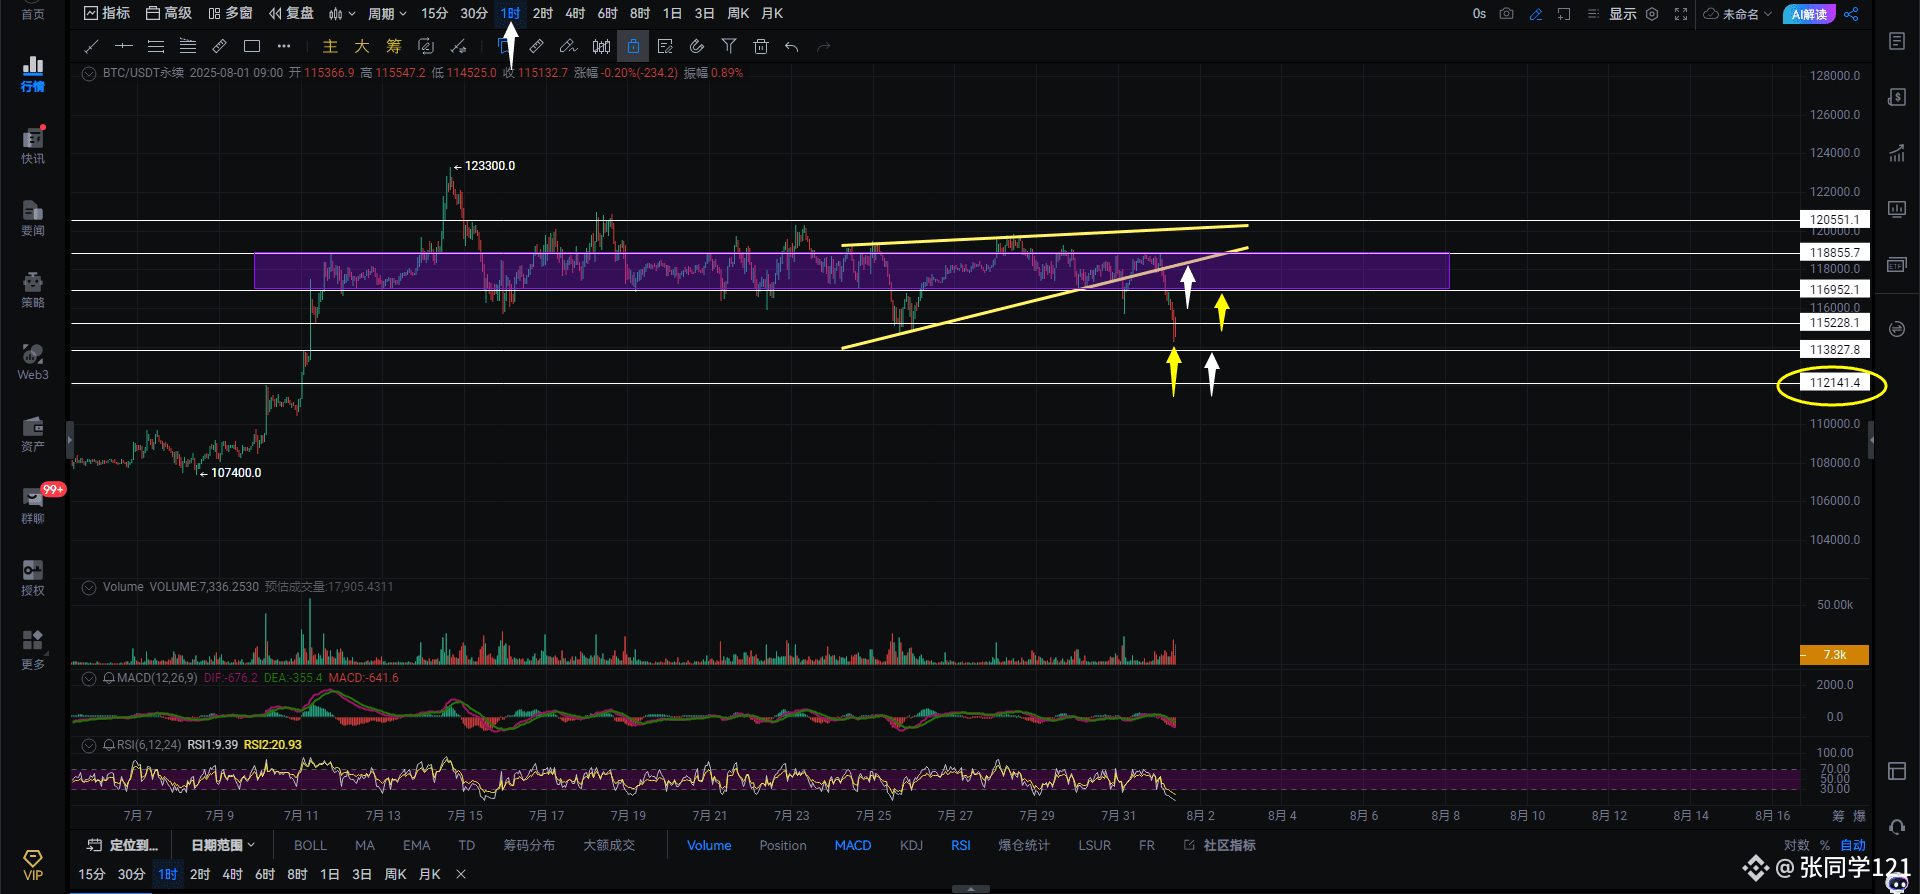
Bitcoin's hourly wedge has broken through the support level, and has reached a lower low.
Hopefully, Bitcoin will take this opportunity to fake out a break below 113827 support, then recover and close the gap at 114000. If it fails to break below 112000, Bitcoin's potential to break through is truly imminent.
Has Bitcoin's decline stopped yet? It hasn't. If it can't rebound above 117000, it will continue to fall.
If it fails to hold above 114200, the decline will continue. The fear is that if it breaks below 114200, the gap won't be filled and a rebound will occur. The gap remains a potential threat.
Are you panicking? Don't worry; it might rebound tonight. 🚀
Upper resistance: 115798-116474-117102
Lower support: 114888-113799-112970
If the 4-hour closing price is below 115210, the downward trend will be 113785-112183. If it falls below 112183, it will be a failure.
🚀🚀🚀🚀🚀🚀🚀🚀🚀🚀🚀
$ETH Strategy:
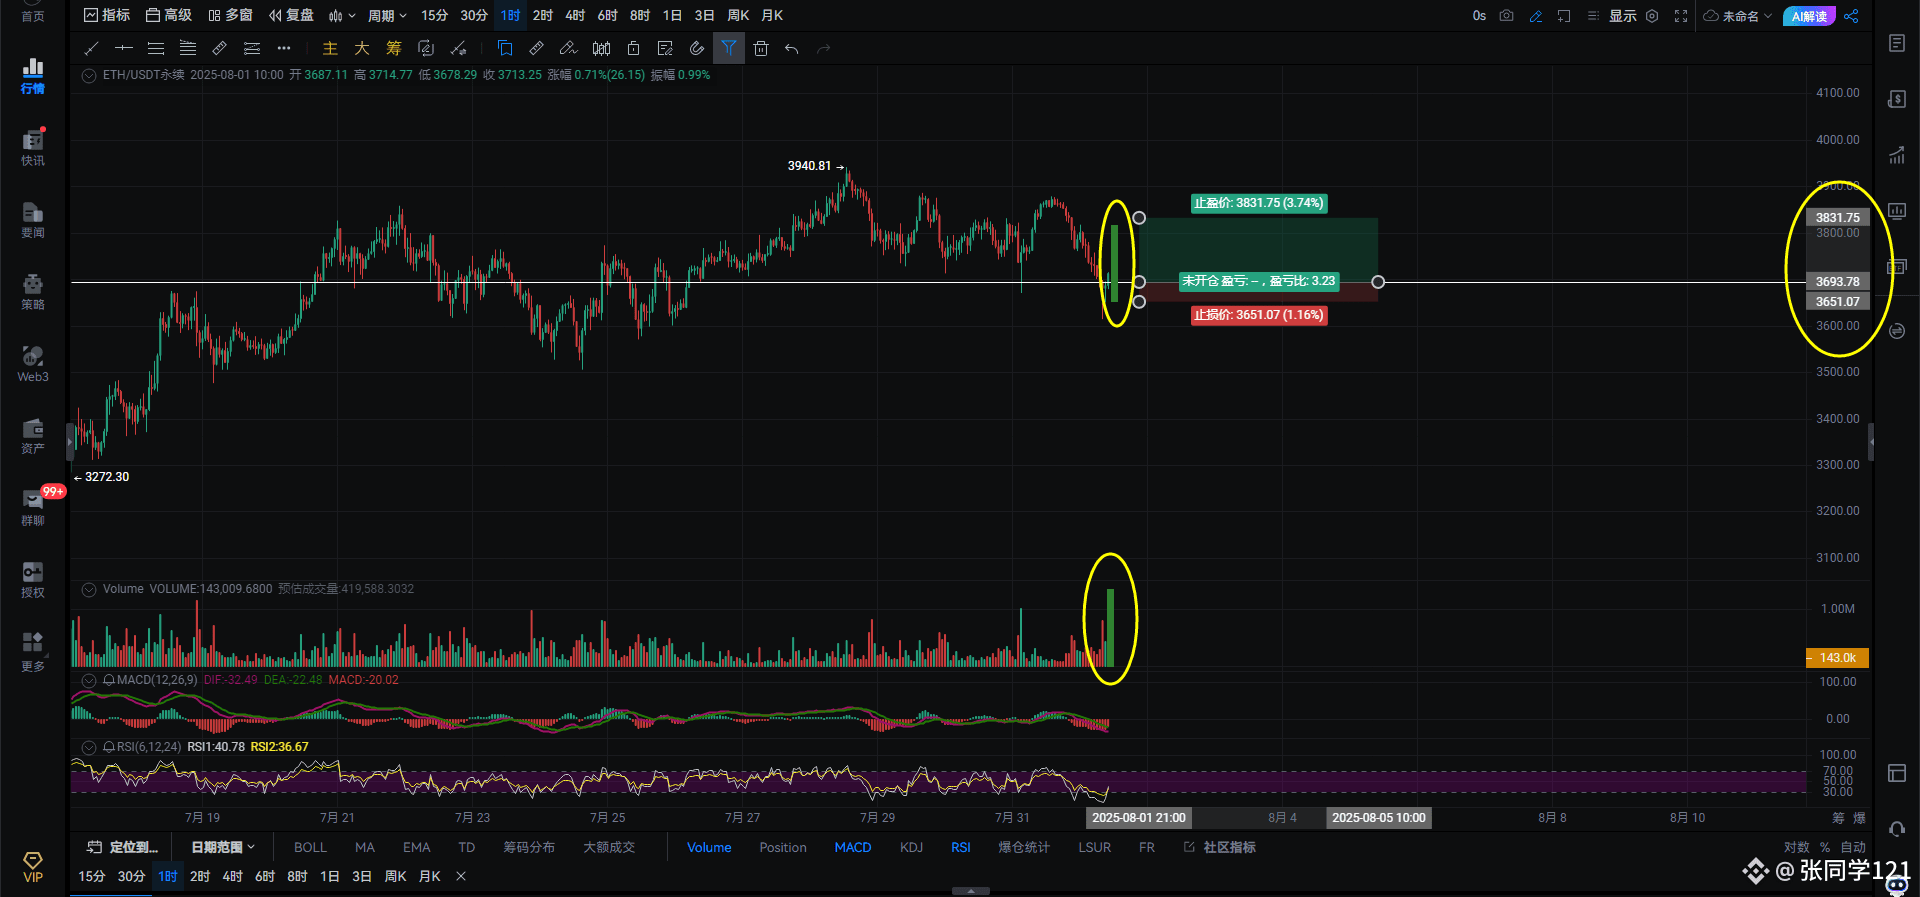
If the price breaks through 3693 on the right side with strong volume, go long on the rebound and withdraw the stop loss.
If it breaks through 3651 on the right side with strong volume, go short on the right side and set a stop loss.
Buy on a pullback to 3600 to confirm support. Stop loss if it falls below 3569.
If the price breaks through 3711 on the hourly chart and stabilizes, the upward trend will be 3753-3797. Watch for 3765 above the 2-day moving average to go short, with a stop-loss at 3800.
Left-side order: Buy at 3524, with a stop-loss below 3500.
🚀
Upper resistance: 3693-3711-3753
Lower support: 3670-3600-3538
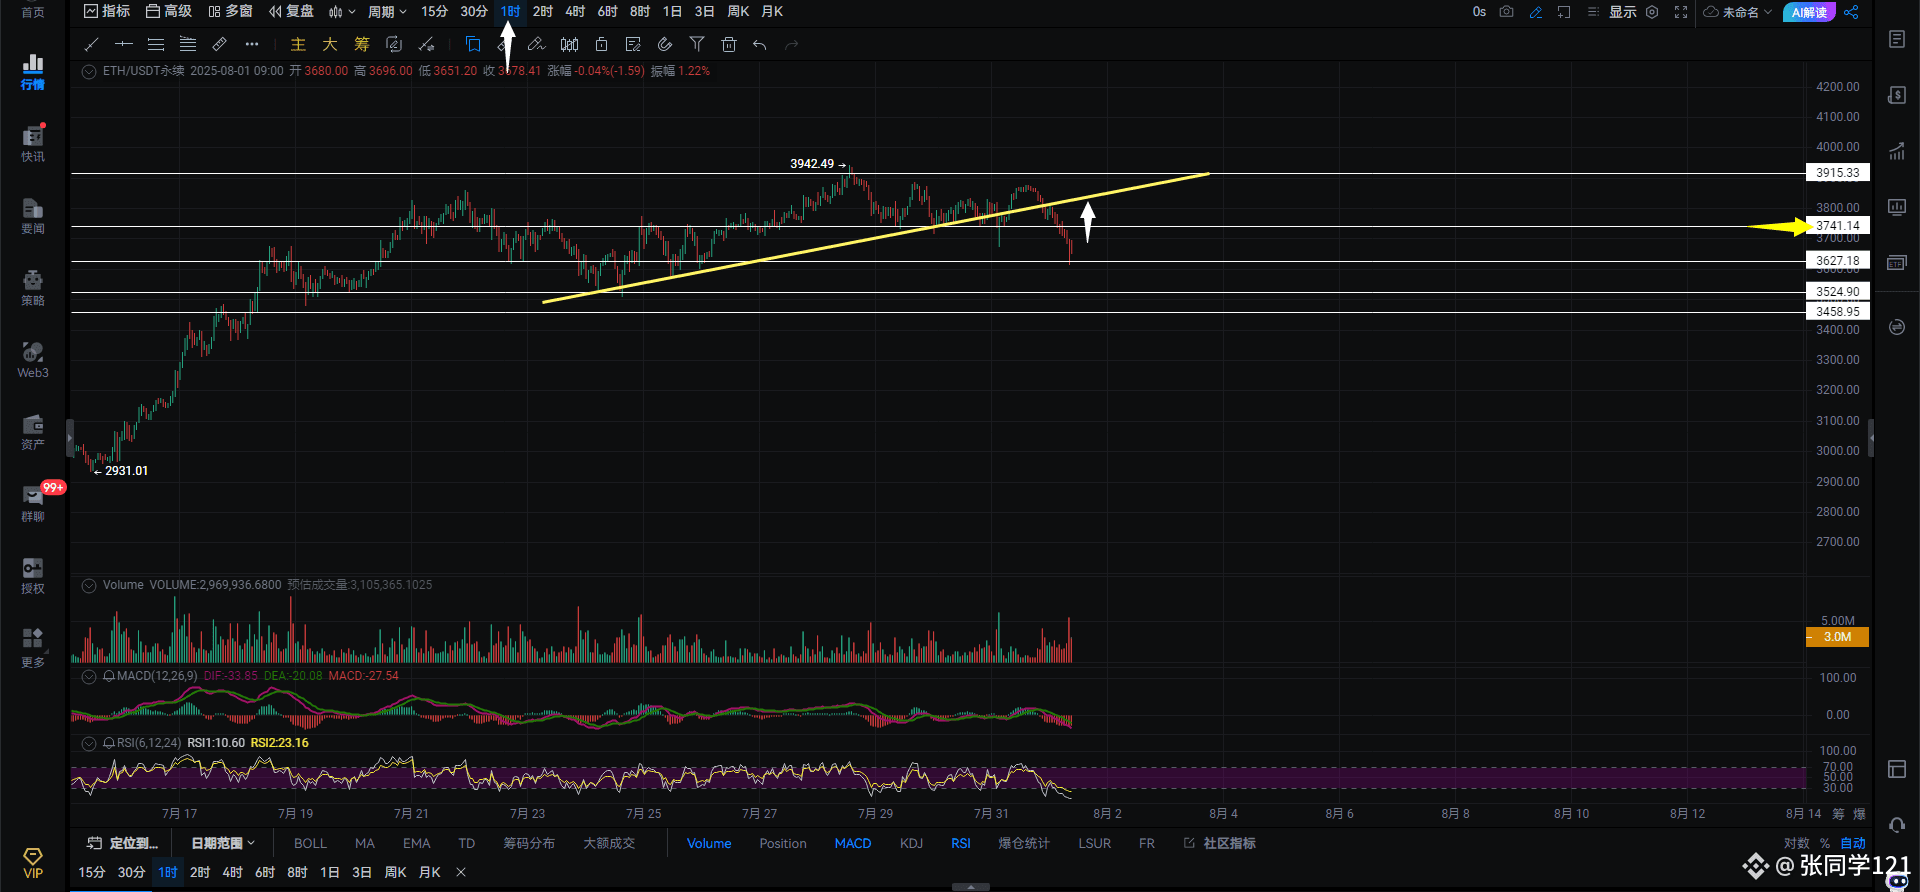
A break below 3615 on the 4-hour chart could lead to a move down to 3538-3505. Even the strong support of 3741 has been broken. If it can't recover, it's a dead end. Dismissal.
$BTC
#US Initial Jobless Claims
{future}(BTCUSDT)
{future}(ETHUSDT)