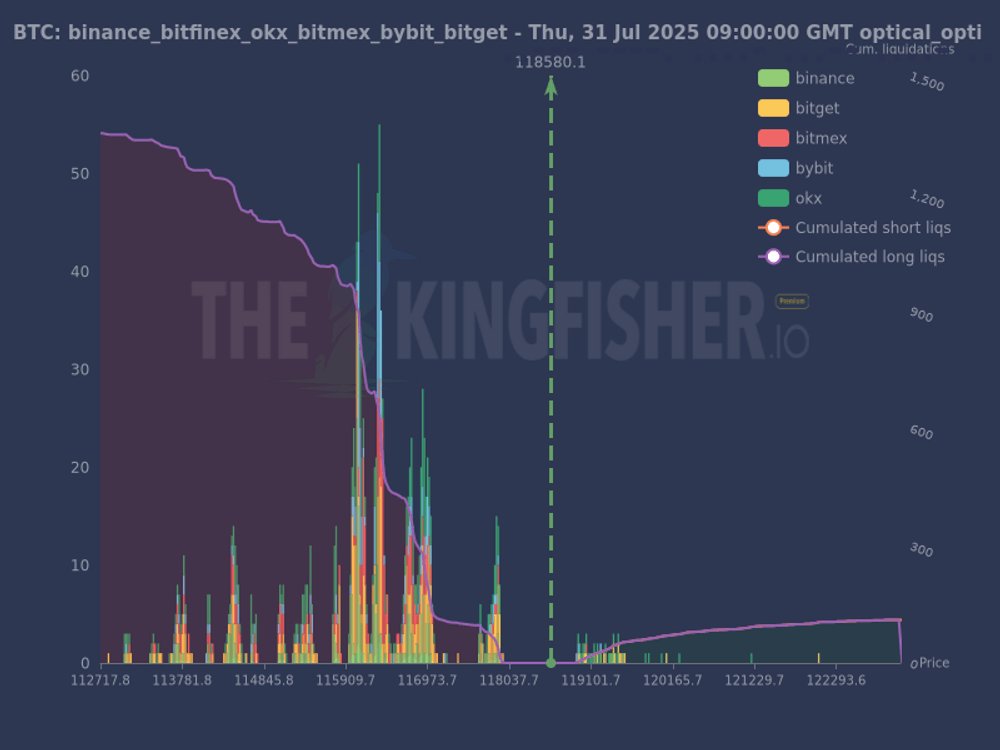
Wow, look at this $BTC liquidation chart 🤯. This is the `optical_opti` timeframe, meaning this liquidity typically clears within a few days to a week.
We're seeing some large clusters of short liquidations around the 115,000-117,000 range. Smart traders like to target these areas because they act like magnets, especially when there aren't many long liquidations on the other side.
There's a pretty clear imbalance in the market right now—if prices rise, short holders will face even greater pain. This could exacerbate the price increase and potentially flush out these shorts. If this momentum continues, keep an eye on the 118,580 level as a potential short-term target.
For risk management, you'll want to set stops just below these major liquidation areas. If price starts engulfing these shorts, it's likely heading towards the next significant liquidation cluster.
Remember, this is all about understanding where the most leveraged players get wiped out. This is a key part that most traders completely overlook.
Watch the full process live: https://t.co/D0Npc8C2vy

