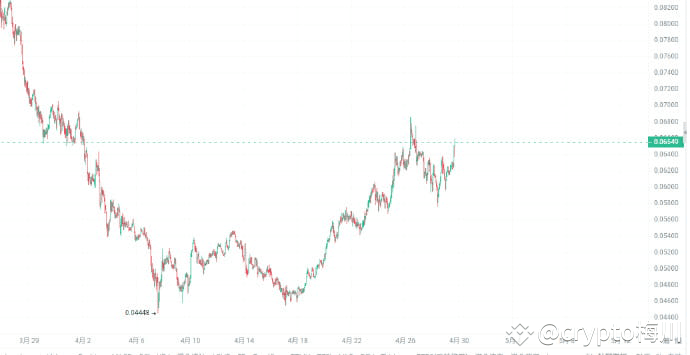
The MAV technical form shows clues: The bottom triangle is consolidated and has hidden breakthrough momentum From the perspective of technical analysis, the daily-level trend of MAV tokens presents a classic convergence triangle shape. As an important relay structure, this form usually indicates that the trend direction is about to arrive.
It is worth noting that in recent trading days, with the completion of pattern construction, the on-chain trading volume has increased significantly, increasing by more than 40% from the previous stage. This combination of volume and price often implies that the main funds are accelerating the process of chip collection.
Through the back-tracking analysis of the resistance level, it was found that MAV lacked obvious trapping accumulation before the price of US$0.14, forming a technical "vacuum upward range".
According to classic morphological calculation theory, if the upper triangular rail suppression is effectively broken, its potential increase target will directly point to the US$0.18 area.
Given that such technological patterns are often accompanied by rapid pull-up in the early stages of breakthroughs, for trend traders, they are currently in a key left-side layout window.
Once a confirmation signal of a large-scale breakthrough is formed, the cost of chasing the rise will increase significantly and face higher short-term volatility risks.
It is recommended to pay close attention to the change in trading volume and verification of breakthrough effectiveness, and seize potential trend opportunities.
#Abu Dhabi Stablecoin #Arizona Bitcoin Reserve #Airdrop Discovery Guide