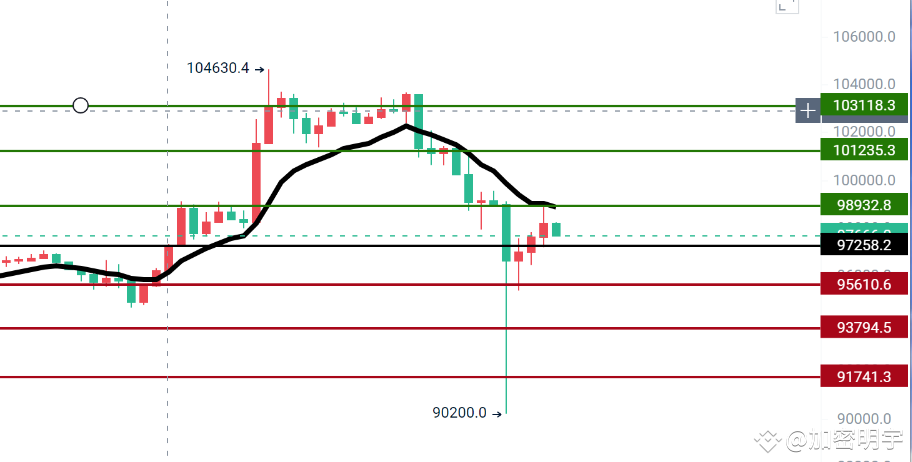
$BTC The daily chart has a consistently long bearish candlestick with an amplitude of 14%, marking the largest fluctuation in the past three months. The daily Bbi extends to 9.64 and shows an upward trend, with the bearish energy column of the indicator Macd continuing to amplify. The fast and slow lines form a dead cross above the zero axis and continue to run parallel. After reaching a historical high, the price experienced a sideways oscillation, with over 1 billion orders taken away in the early morning.Focus on the gains and losses of the key position of 9.72 for 4 hours, which is the boundary point that both long and short teams need to strive for. Last night, a total of 752 million yuan of spot goods flowed in, and BlackRock alone flowed in 748 million yuan. The rise and fall were all thanks to him. Upward pressure is 9.89-10.1-10.3. Lower support 9.56-9.37-9.17.Many armies on the clearing map (daily line) have been cleared, and there are a large number of air forces waiting to be cleared above 100000In terms of operation (short-term), if the price reaches above 9.89, do not short, put the stop loss at 9.95Trading strategy: Short around 9.87, long in 9.37 and 9.42 areas.Please refer to the actual situation for specific operations. There may be delays in posting, and there may be investment risks. Please take your own losses according to your own ability to bear them. We appreciate your praise and attention# DOGE craze{future}(BTCUSDT)#Historical Witness Check in