For a decade, private equity firms have been touting low volatility and portfolio diversification. This is essentially volatility whitewashing. Not pricing in market capitalization doesn't mean there are no losses. It means problems won't be discovered until it's too late. And now, it's too late.
Bitcoin's position is rising as the illusion of a fractional-reserve credit system for fiat currencies stumbles from one crisis to another. 🧵
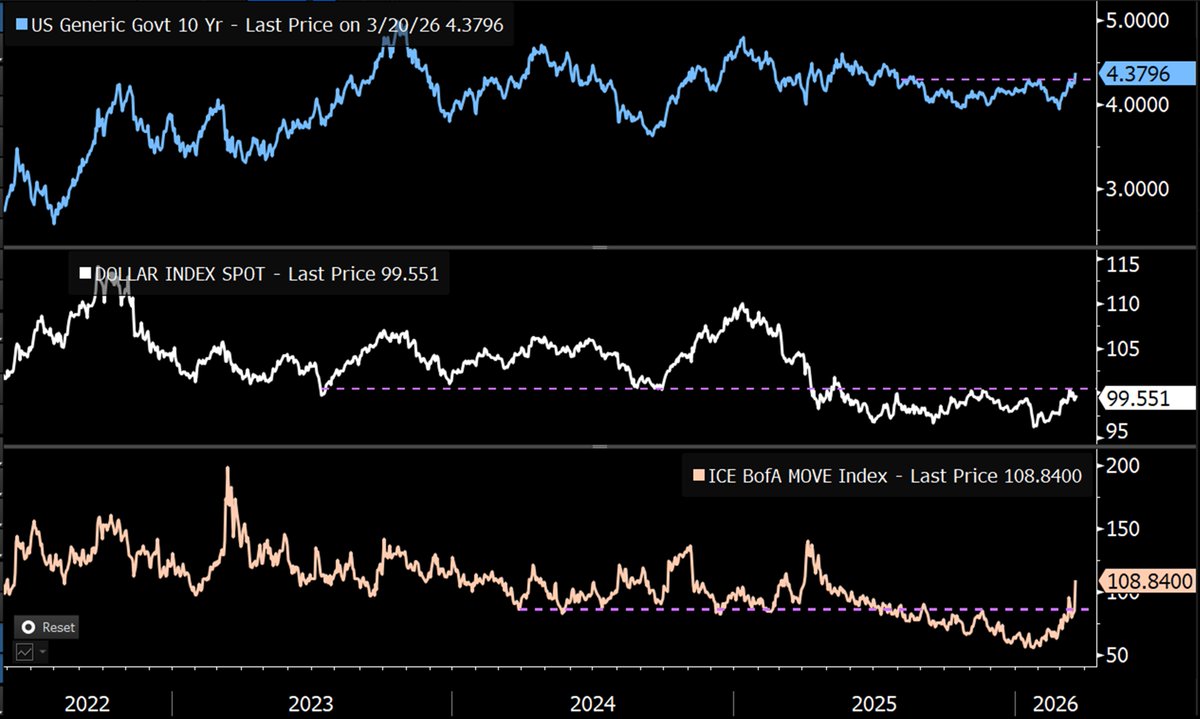
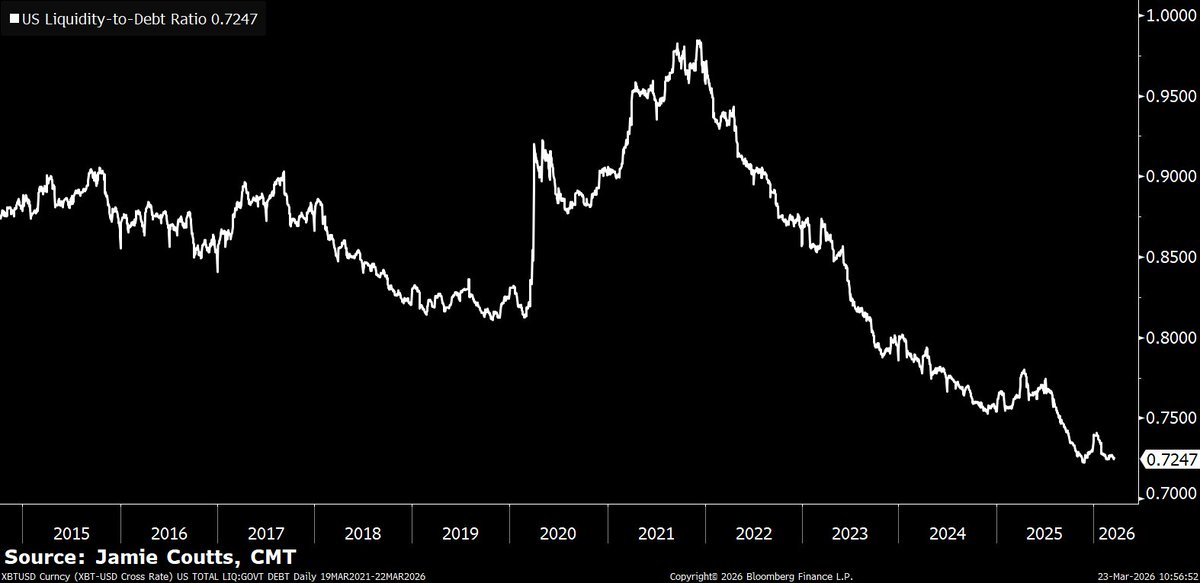
Liquidity is under pressure. The MOVE index is soaring. The US Dollar Index (DXY) is nearing the warning line of 100.50. Credit conditions are tightening in private equity and AI-related sectors. Inflation expectations are currently rising significantly. The macroeconomic outlook is not optimistic.
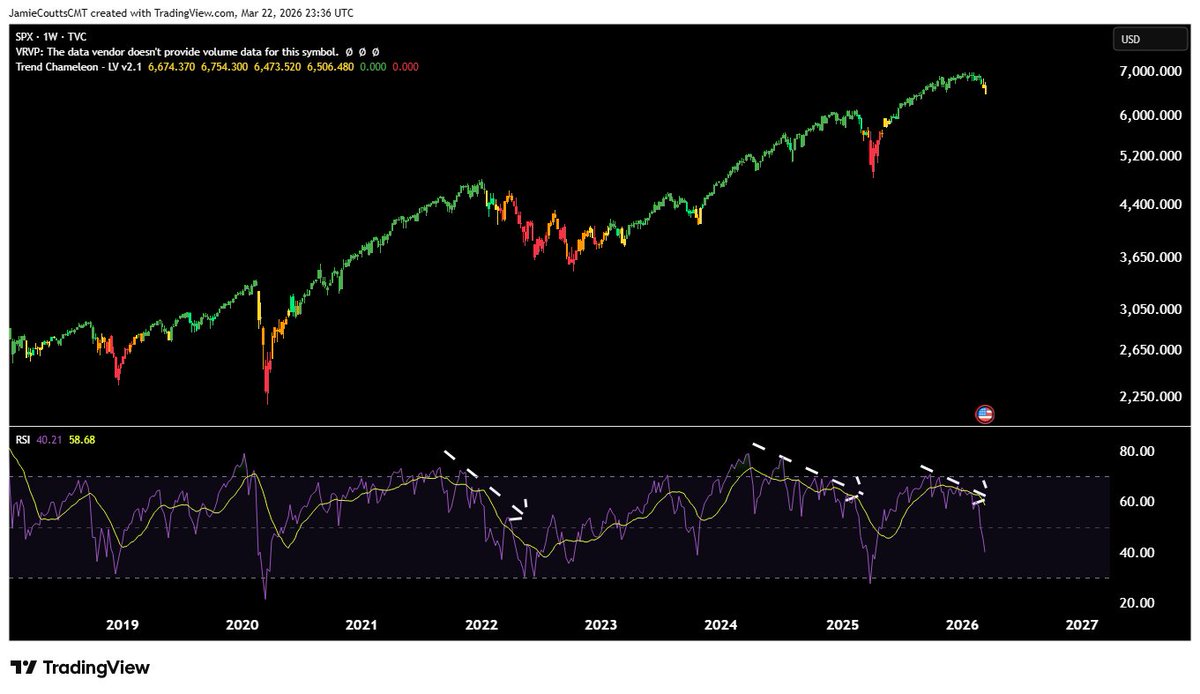
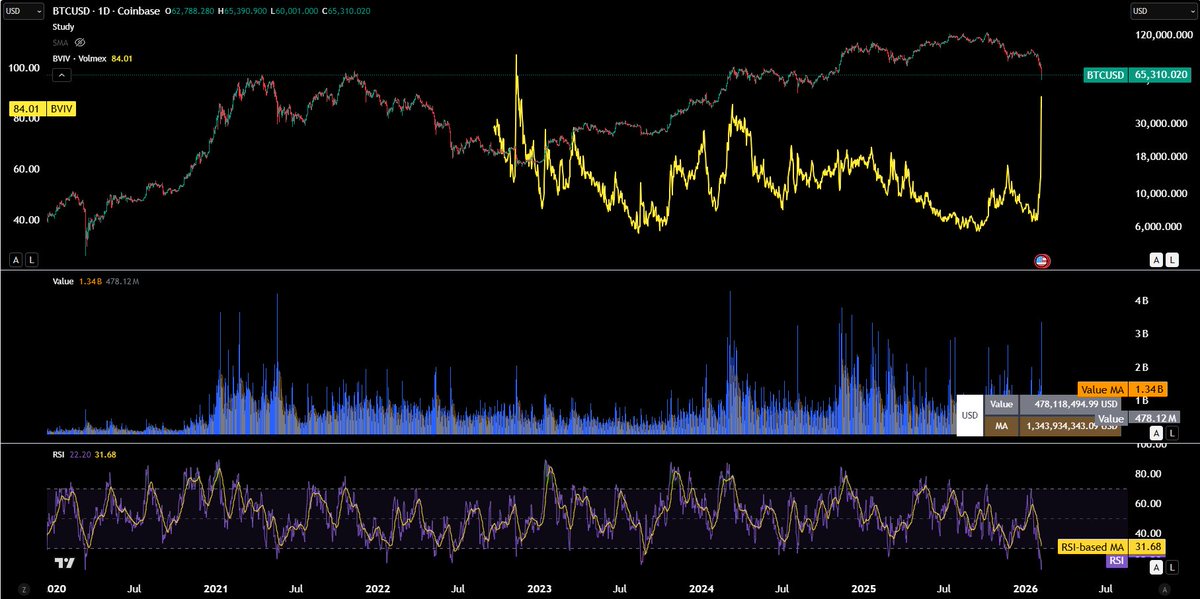
Stock markets are reacting sluggishly. However, this year, the Relative Strength Index (RSI) for major stock indices is diverging—prices are hitting new highs while momentum is waning. This is a typical late-cycle top pattern. The market expects a soft landing for the economy. But the credit market is not.
Bitcoin's resilience last month stemmed from two factors. The capitulation sell-off triggered by the February lows cleared out previously accumulated leverage—the excessive leverage built up before 2025. Derivatives further compressed volatility before 2025. But this was merely structural support, not genuine strength. Given that all risk assets face typical 10-15% drops, this buffer no longer exists. The February lows have resurfaced.
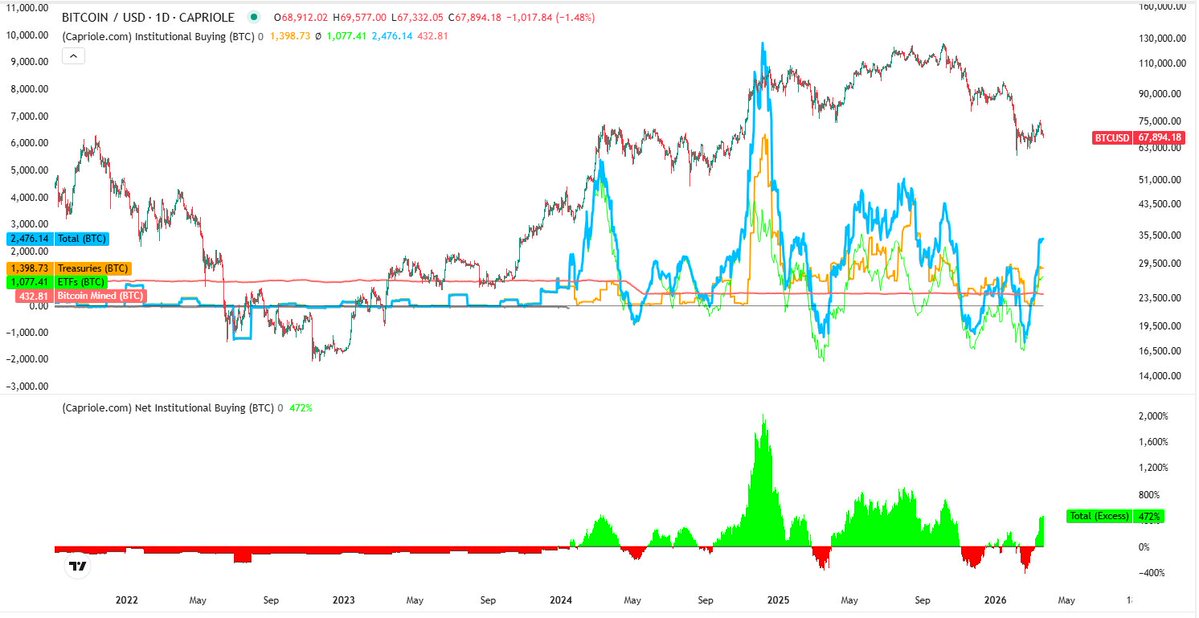
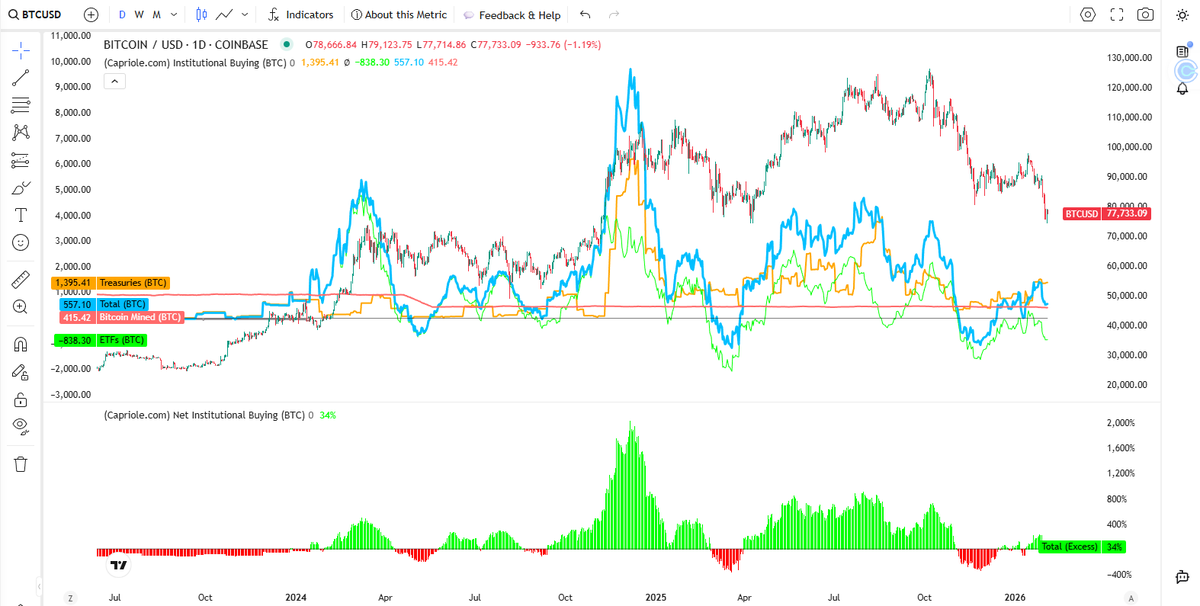
Inflows into Bitcoin ETFs surged again in March, but may have peaked and begun to decline.
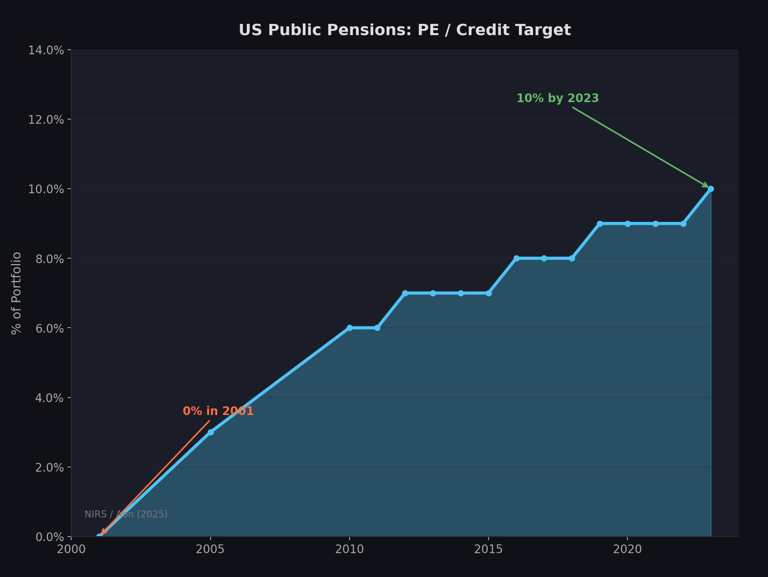
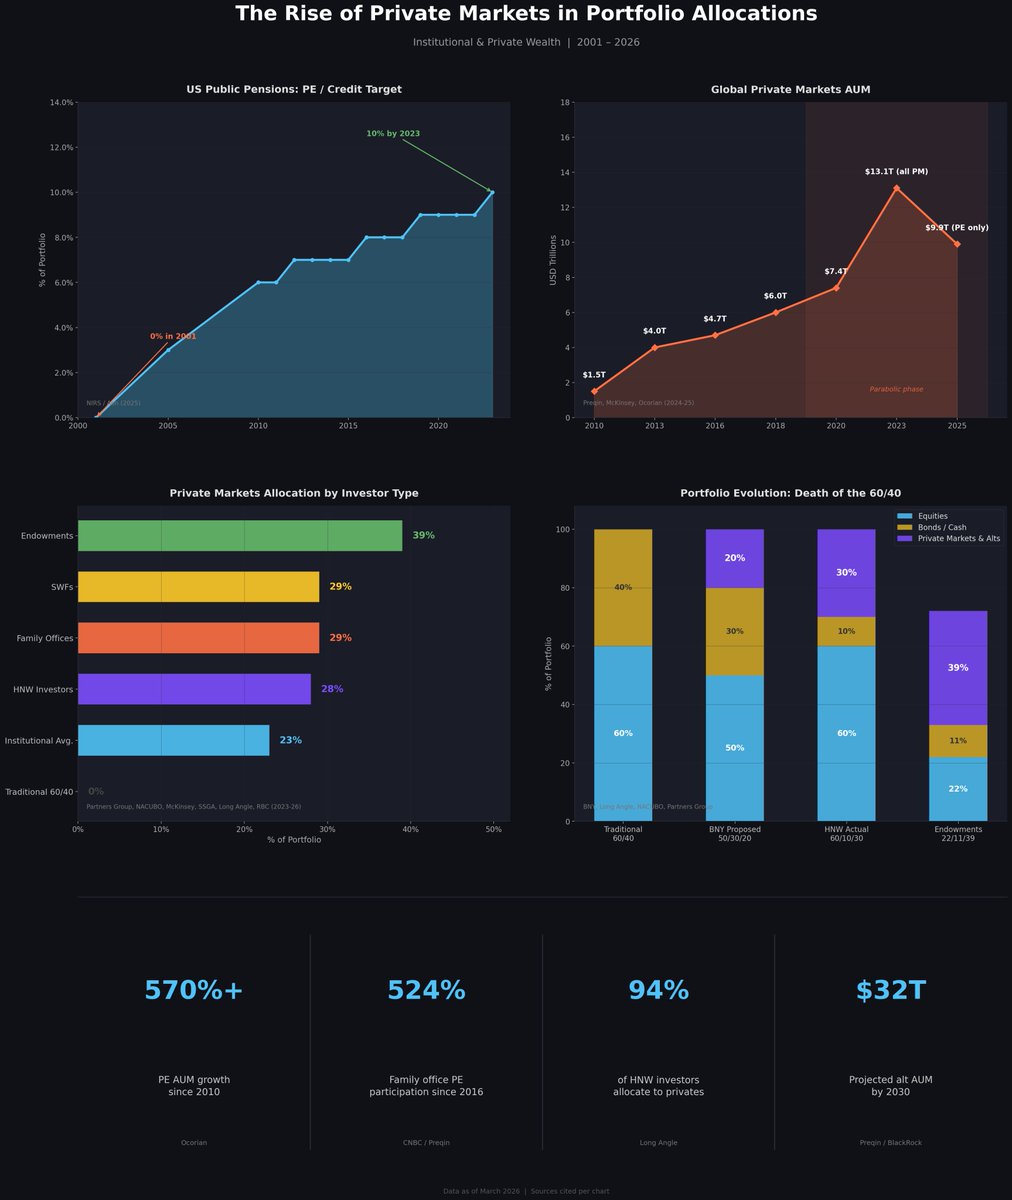
Short-term bearish, long-term bullish. Here's why. This is the range of risk traditional investors face. Since 2010, private equity fund assets under management have grown by over 570% and are projected to reach $32 trillion by 2030. Institutional investors' share of the private market has risen from 17% to 27% in a decade. 94% of high-net-worth investors now hold alternative investments. Its selling points are: low volatility, diversification, and uncorrelated returns. The reality, however, is: volatility for money laundering. Opaqueness does not equal stability. Asset prices are constantly adjusting. You simply cannot predict when this will happen.
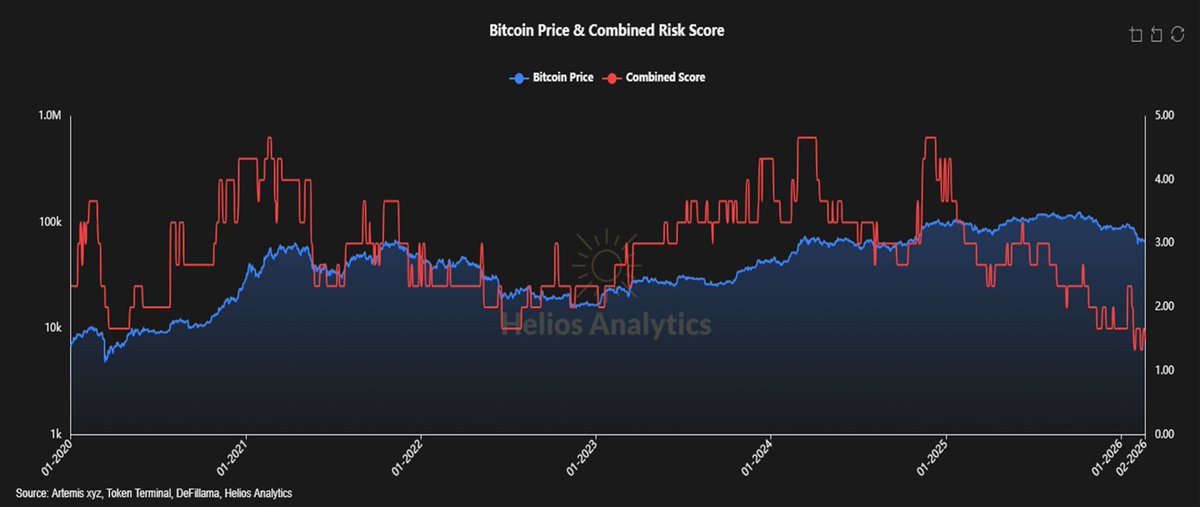
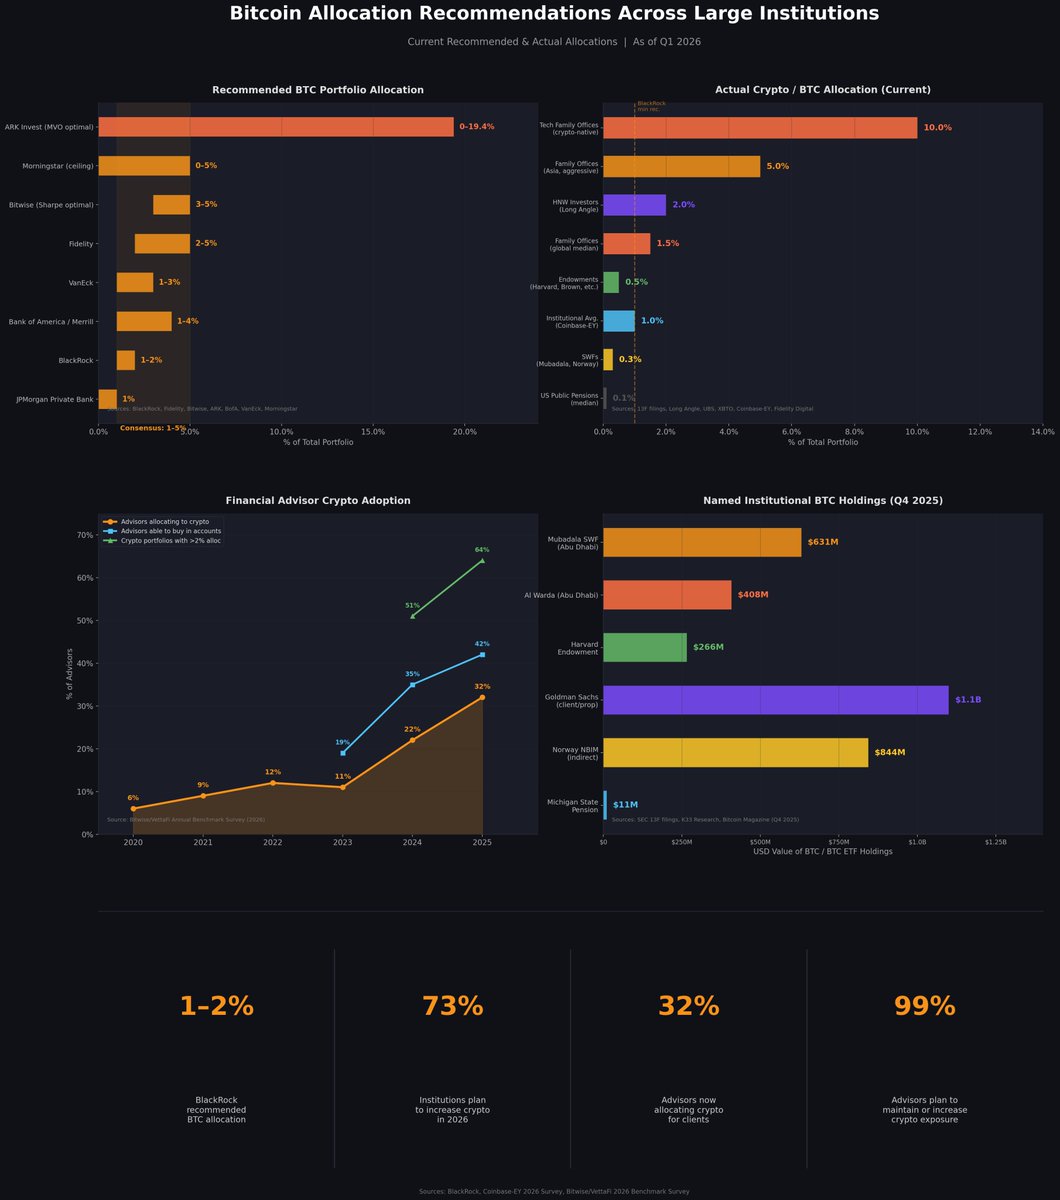
Now imagine what will happen to Bitcoin when all this happens. All risks will be repriced. But Bitcoin's volatility relative to traditional assets has been declining for years. Transparent ledger, real-time settlement. No valuation methods based on fantasy. The recommended weighting is for reference only. Actual allocation will increase, and the recommended weighting may increase accordingly.
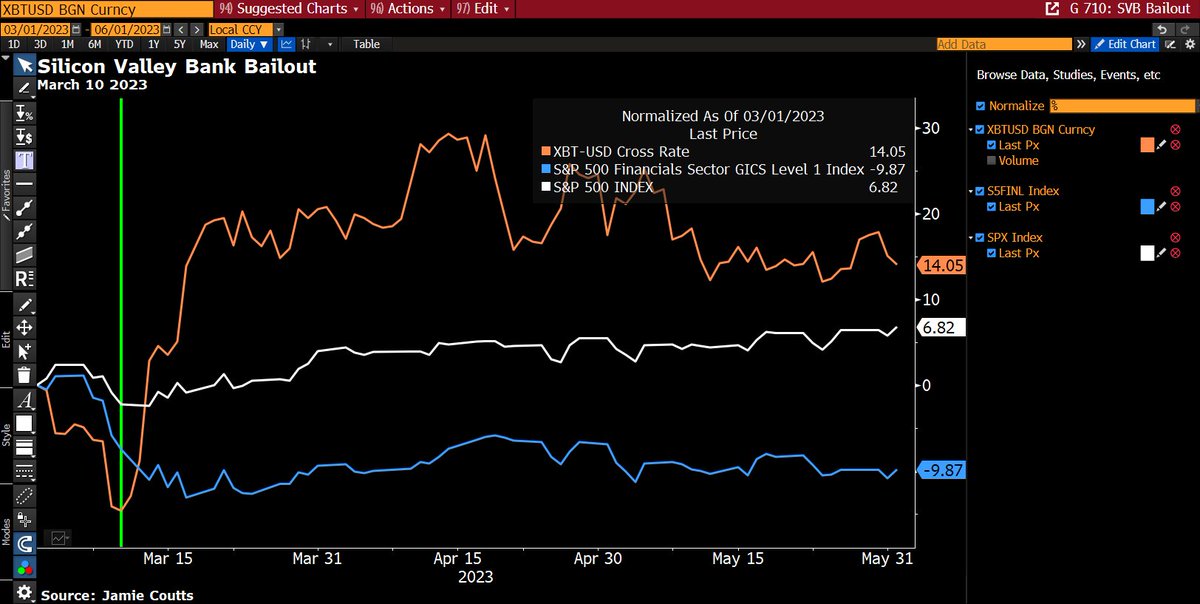
When the bailout plan arrives—and it will eventually—this asset will be the first to smell its scent.
Despite the government/Federal Reserve's vehement denial of ample liquidity.

Price Converter

- Crypto
- Fiat
USDUnited States Dollar

CNYChinese Yuan
JPYJapanese Yen
HKDHong Kong Dollar
THBThai Baht
GBPBritish Pound
EUREuro
AUDAustralian Dollar
TWDNew Taiwan Dollar
KRWSouth Korean Won
PHPPhilippine Peso
AEDUAE Dirham
CADCanadian Dollar
MYRMalaysian Ringgit
MOPMacanese Pataca
NZDNew Zealand Dollar
CHFSwiss Franc
CZKCzech Koruna
DKKDanish Krone
IDRIndonesian Rupiah
LKRSri Lankan Rupee
NOKNorwegian Krone
QARQatari Riyal
RUBRussian Ruble
SGDSingapore Dollar
SEKSwedish Krona
VNDVietnamese Dong
ZARSouth African Rand
No more data