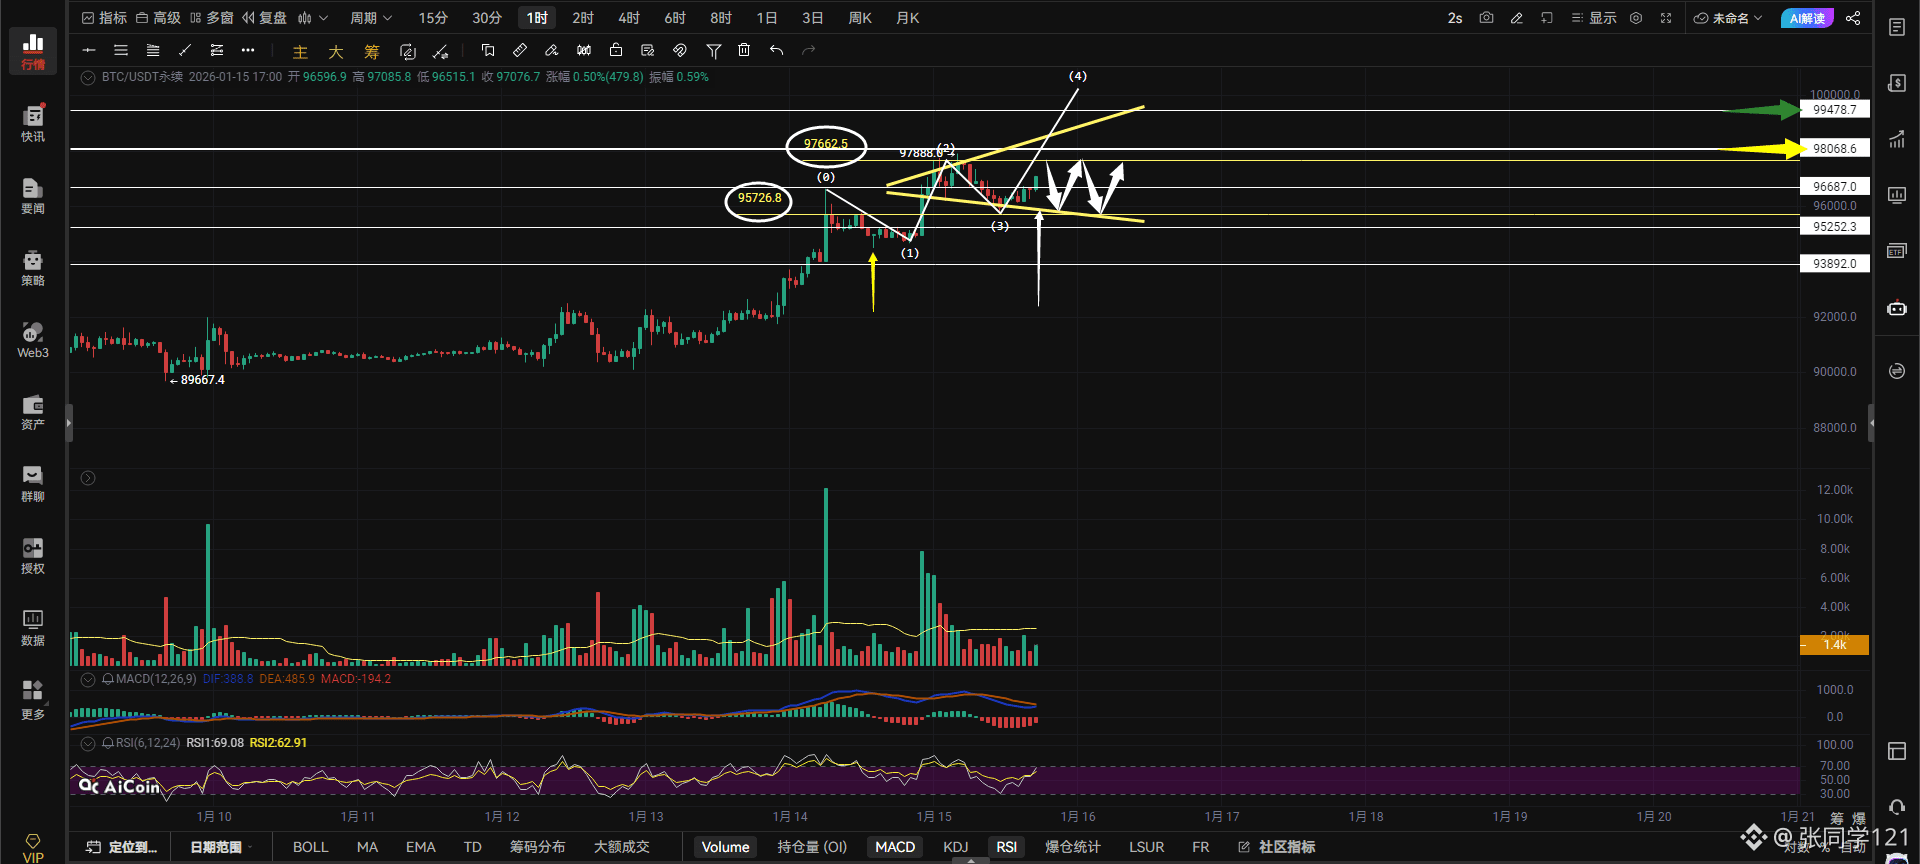
$BTC Evening Commentary: Bitcoin is still consolidating within a megaphone pattern, and a W-bottom has formed. The neckline of this W-bottom, circled in white, is 97662, which is currently Bitcoin's resistance level. A break above 97662 is needed to confirm the hourly W-bottom and continue upward towards 98068 and 99478.
If it fails to break above 97662, the W-bottom cannot form. If a pullback occurs, as long as it doesn't break below 95726, a deep pullback is unlikely. Even if it breaks below 95726, as long as it doesn't break below 94500 (indicated by the yellow arrow), which is the lower boundary of the megaphone pattern, it won't retest the 93892 level.
If it can't break through either level, it will likely consolidate between 95726 and 97662. Remember, if this upward attempt fails to break the previous high of 97888 and create a higher high, you should either close all your long positions at the bottom, or at least close 70% of them, using the remaining 30% to try and find higher levels.
If Bitcoin fails to break through the previous high, a significant pullback is inevitable unless it breaks and holds above 98068, reaching even higher highs to break out of the current consolidation zone. Remember this!
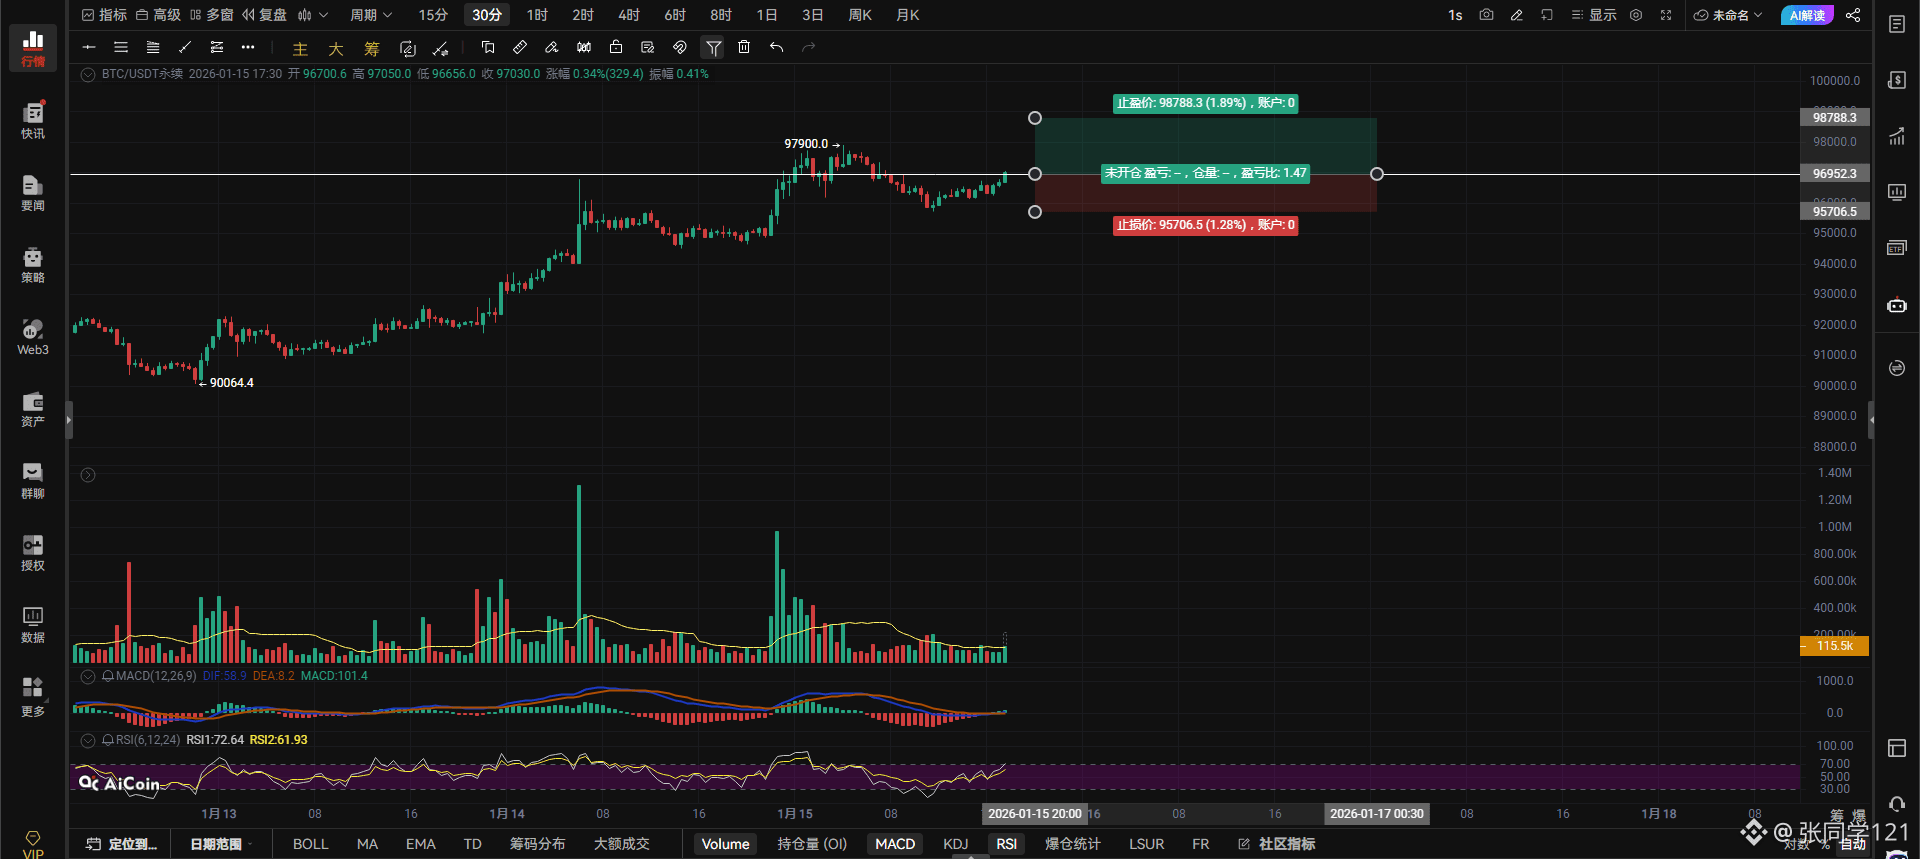
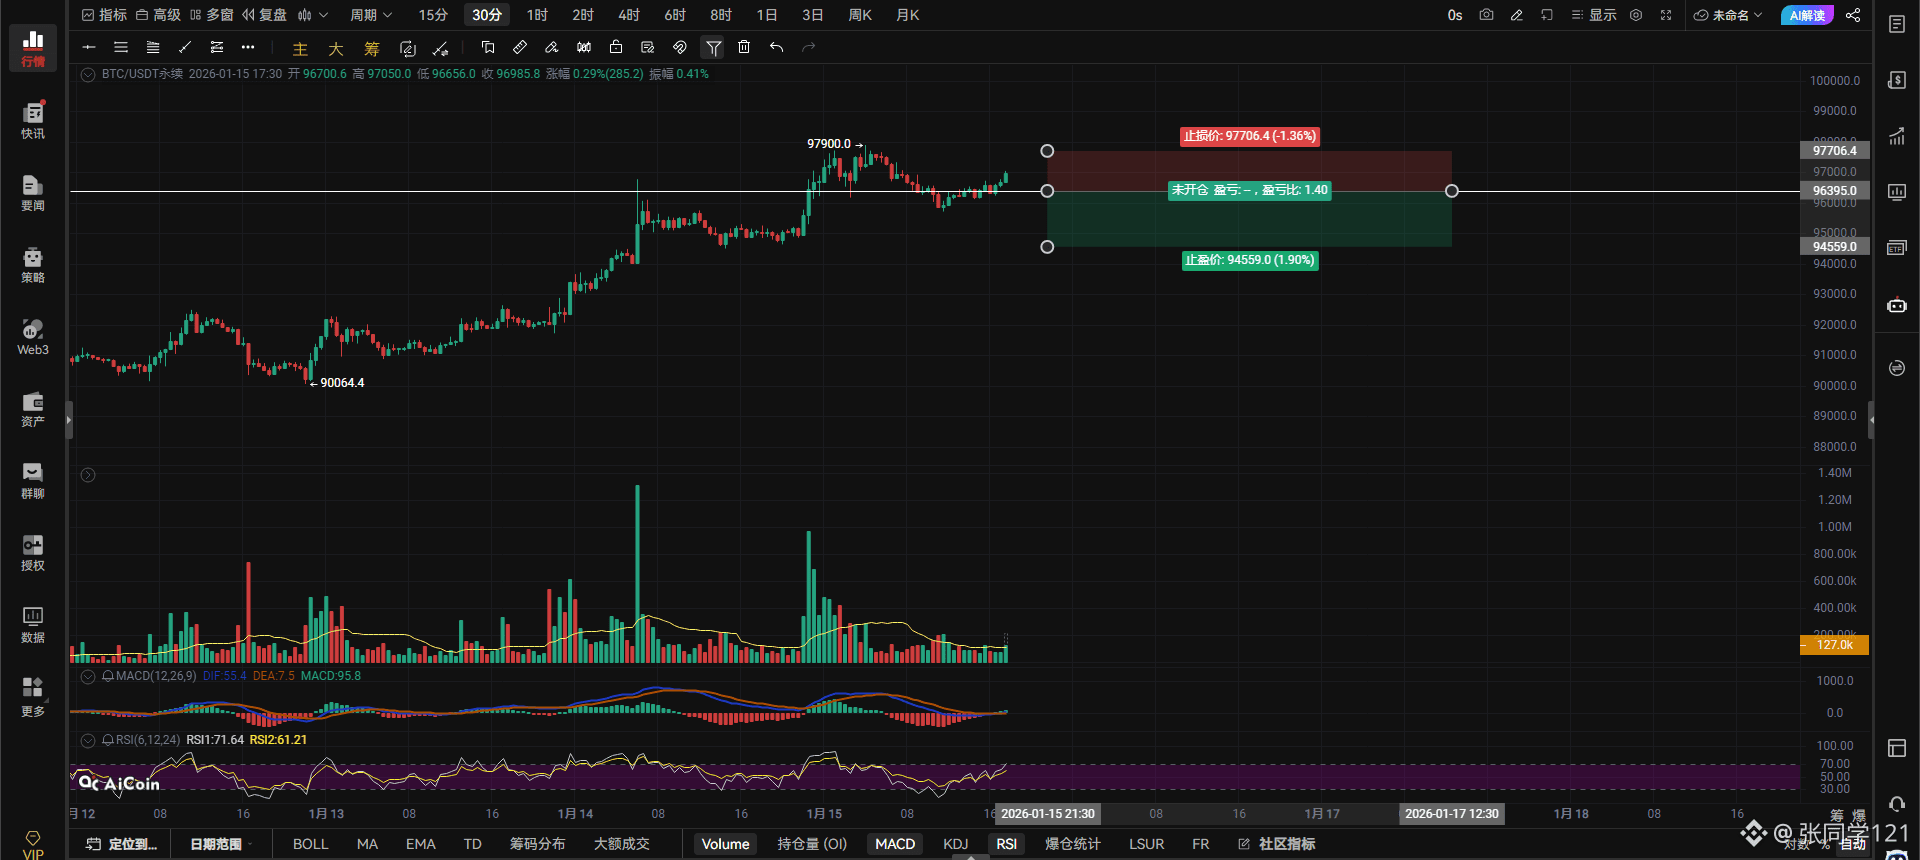
If Bitcoin breaks through 96952 with volume, consider going long. If it breaks below 96395 with volume and fails to recover on a pullback, consider going short, with stop-loss orders in place.
On the hourly chart, a break and hold above 97662 targets 98068-99478. A hold above 97662 will likely lead to further gains.
On the 4-hour chart, a break below 96231 targets 95726-94716. A break below 96231 without a recovery indicates a pullback.
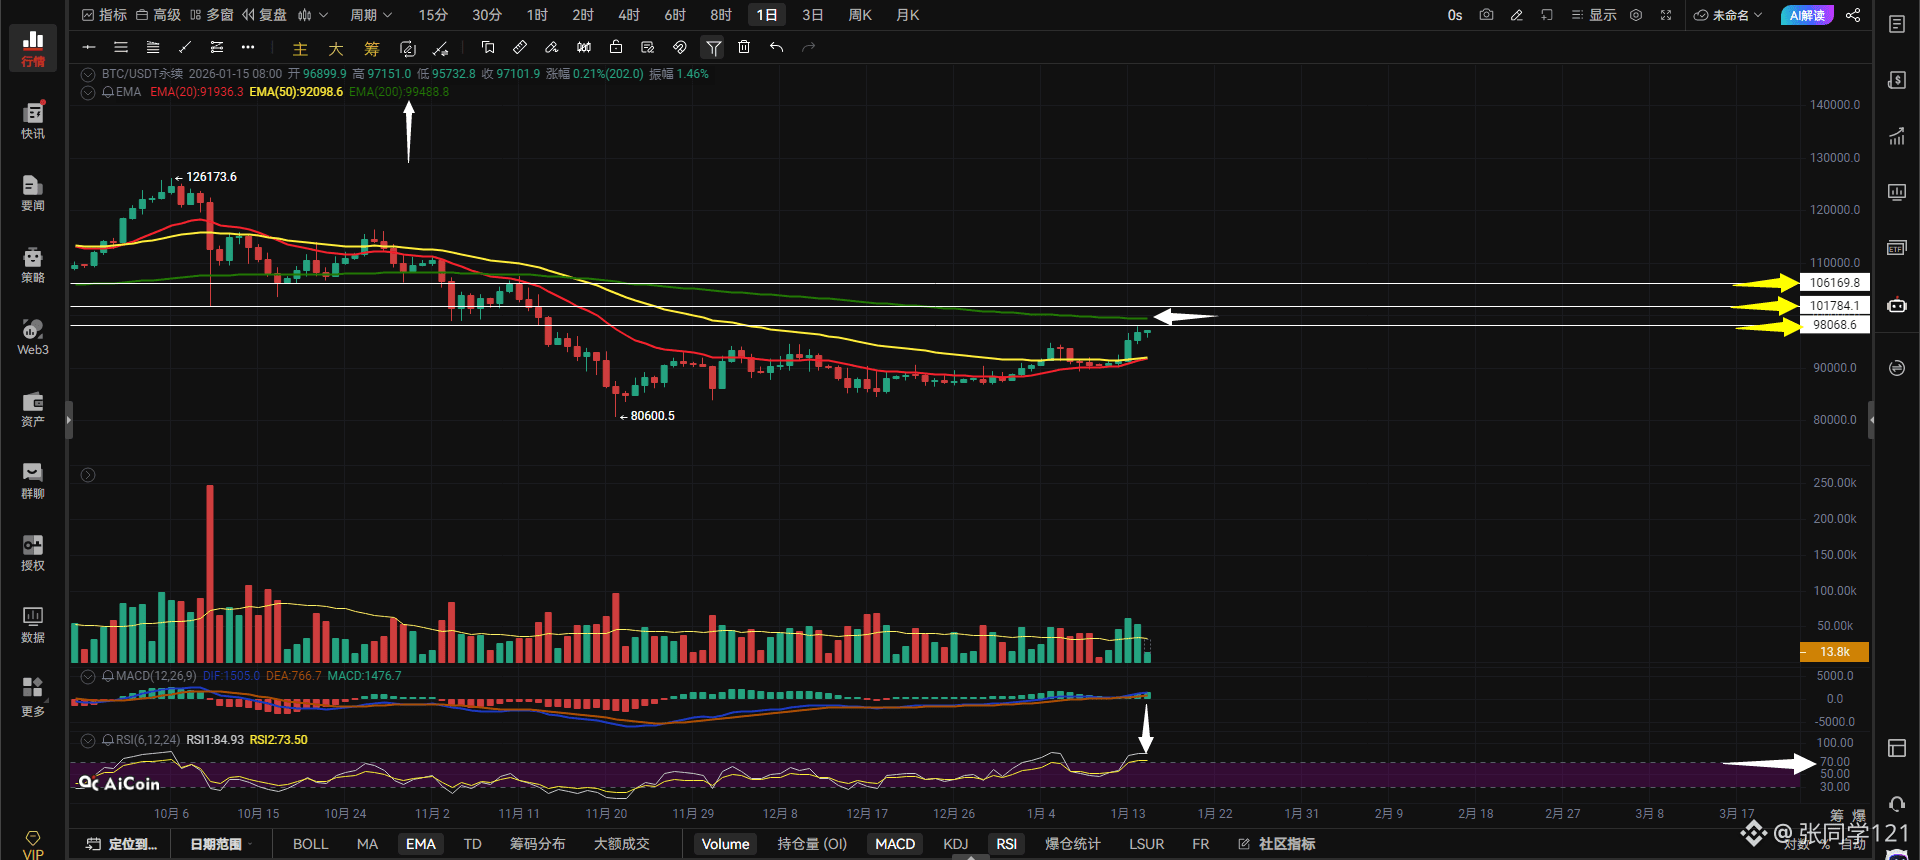
On the daily chart, the 200-day EMA acts as resistance. A break and hold above the 200-day EMA will likely lead to the levels indicated by the yellow arrows on the right.
Bitcoin, having stabilized above the 200-day EMA on the daily chart, could reach 100,000 in the blink of an eye. The real fear is that it might get stuck there and that would be the end of it.
This drop below the 200-day EMA has lasted for 96 days, almost 100 days. Logically, it should be returning to hover above the EMA. However, there's a noteworthy point on the daily chart: the RSI (indicated by the white arrow) has crossed above 70, indicating overbought conditions. A pullback is expected after crossing 70, which is something to watch out for. I don't know when the pullback will occur. The only way to prevent a pullback is to break through the resistance at 98068 and stabilize above the 200-day EMA. This is the only way; there's no other way. Pay close attention to volume changes. Meeting adjourned.
$BTC
#StrategyIncreaseBitcoinHoldings
{future}(BTCUSDT)