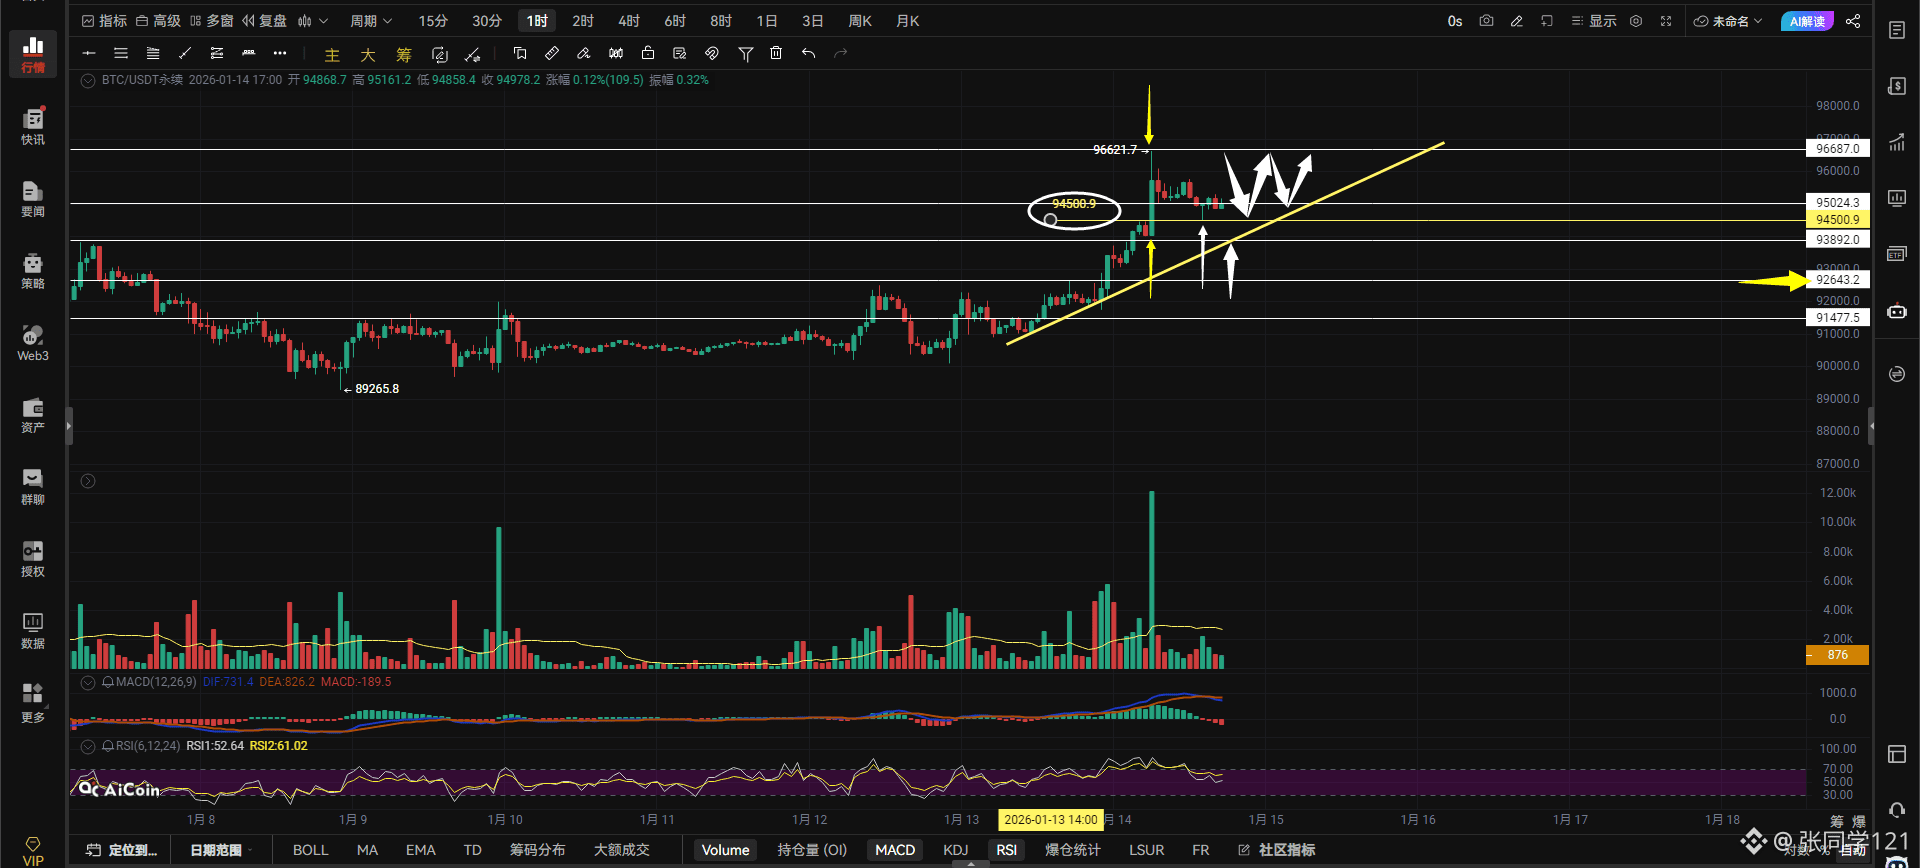
$BTC Evening Commentary: Bitcoin's hourly chart shows a top signal at the level indicated by the white arrow, and a brief bottom signal at the level circled in white below, corresponding to the psychological level of 95,000. Why is 95,000 considered a brief signal?
Look at the candlestick indicated by the white arrow; because it closed as a hammer, it indicates support at this level.
After breaking through 96,621, Bitcoin began to pull back. The pullback paused at 95,000 and formed a hammer candlestick, suggesting that someone is controlling the price to prevent further declines, hence the hammer candlestick pattern.
Bitcoin won't test the bullish trend line indicated by the white arrow below as long as it doesn't fall below 95000. It also won't experience a deep pullback unless it breaks below this trend line. This trend line corresponds to the price of 93892, which is also the lowest price of the large bullish candle indicated by the yellow arrow on the left. Just remember, as long as 95000 isn't broken, it won't retrace to this bullish trend line; if it breaks below 95000, it will definitely retrace to this trend line, and if it can't hold, it will test the support at 92643. For it to rise, it must break through 95762. Only after breaking through 95762 can we look for the previous high or a new high. The market moves as it unfolds, and no one knows what tomorrow will bring. Since the bullish trend has already formed, let's wait patiently!
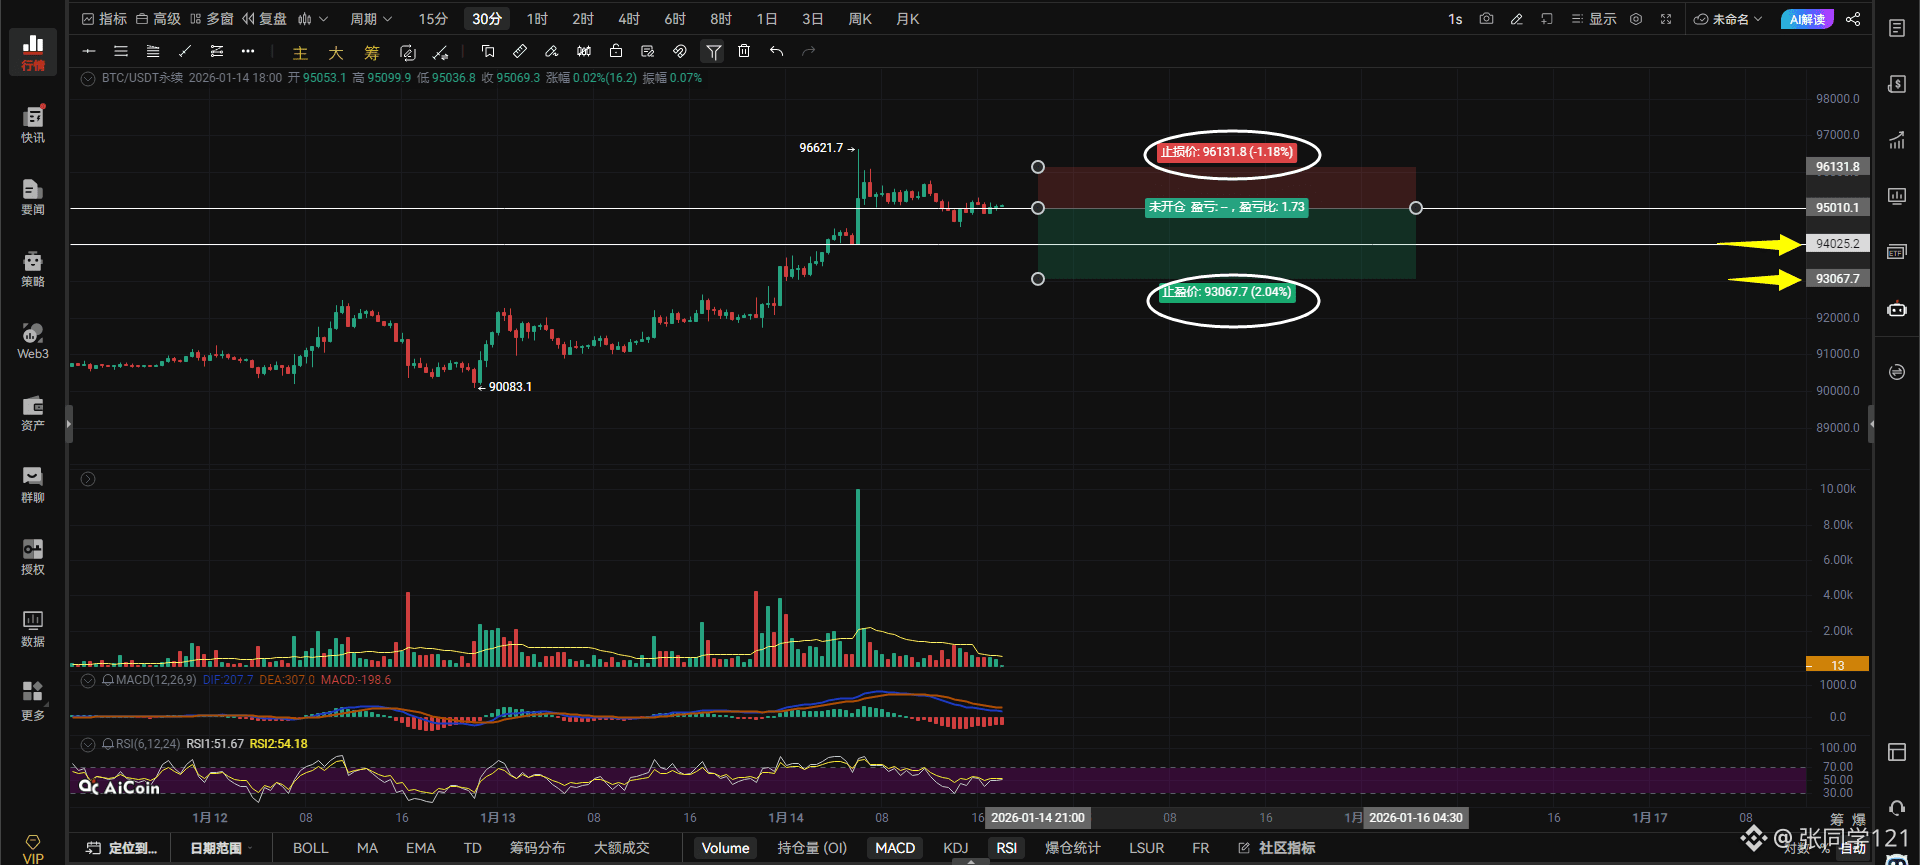
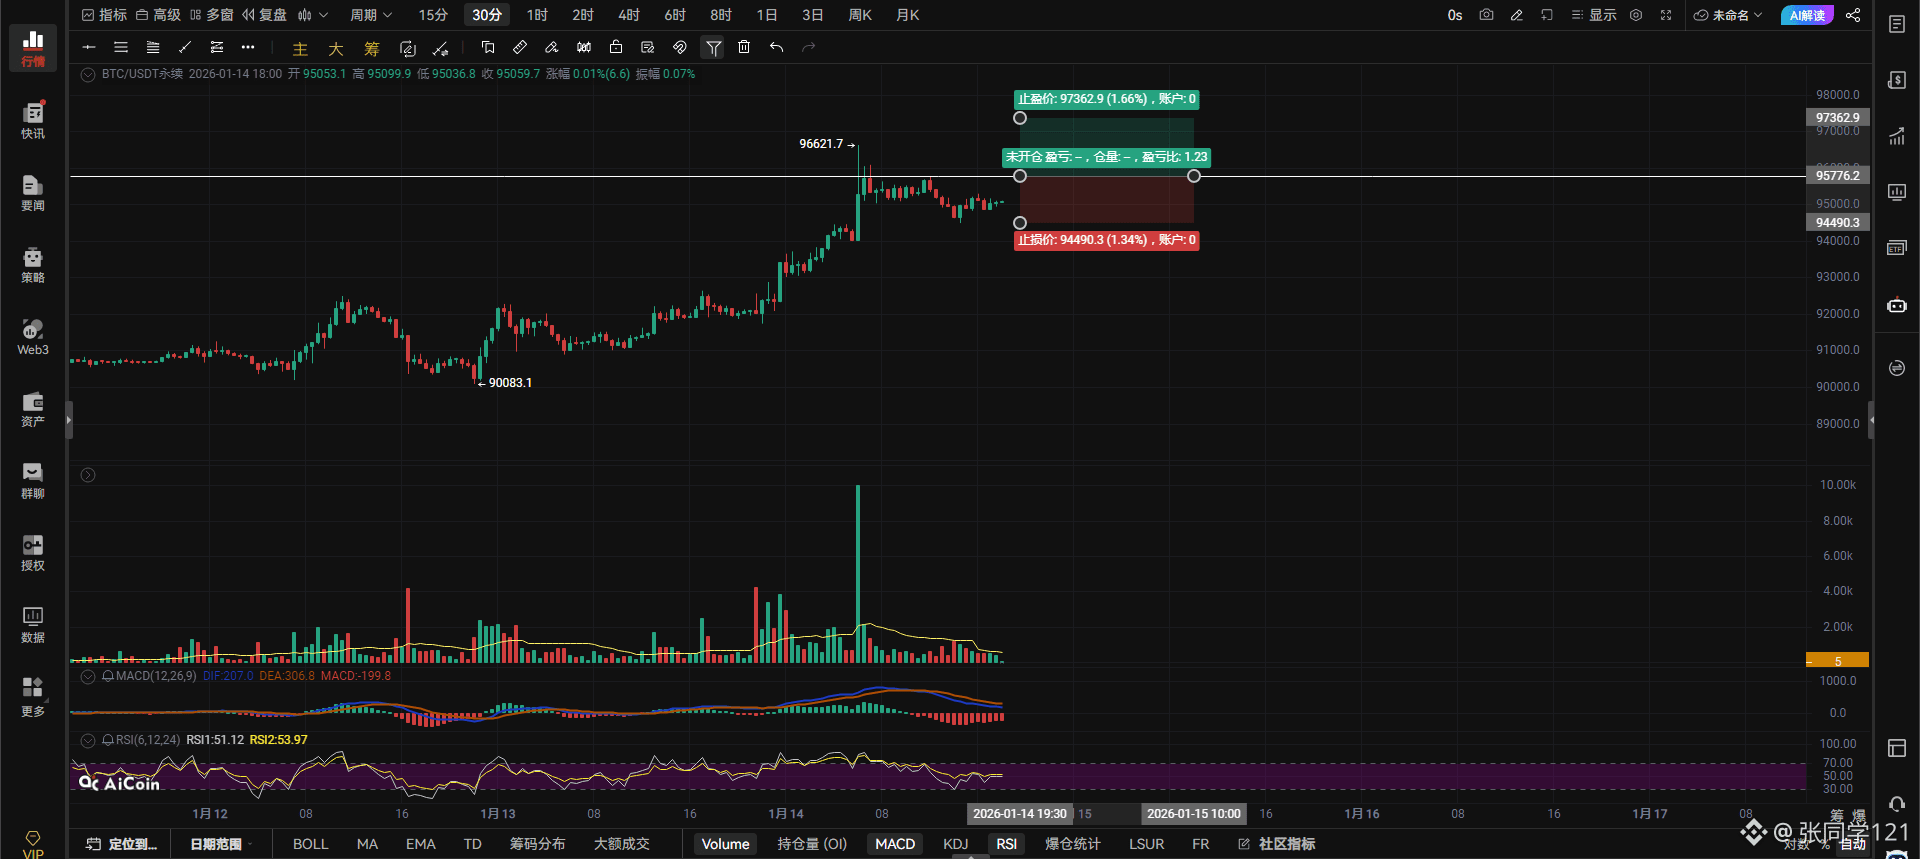
If Bitcoin breaks through 95776 with volume, go long on the right side. If it breaks below 95010 with volume and fails to recover on a pullback, go short on the right side, with a stop-loss order in place.
Bitcoin's hourly chart shows a breakout and hold above 95776, targeting the previous high of 97362. A break above 97362 would naturally lead to a move towards that level.
On the 4-hour chart, a break below 94482 targets 93038-92376. A break below 94482 without a recovery indicates a pullback is inevitable.
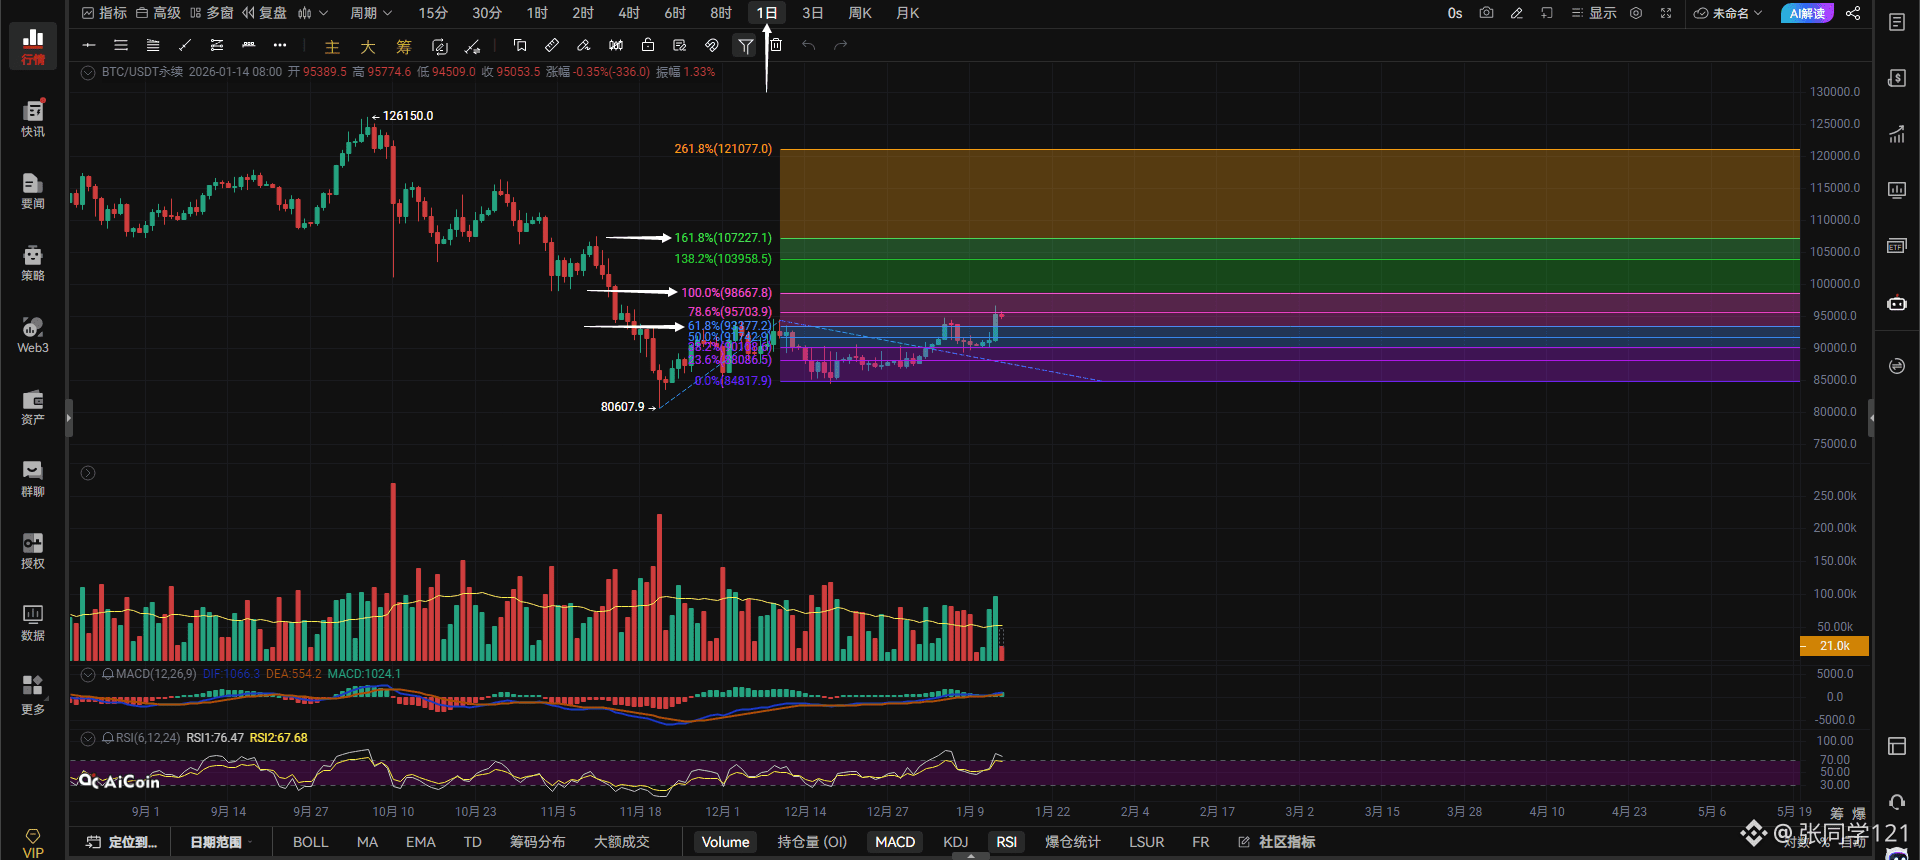
On the daily chart: Bitcoin has now firmly established itself above the 61.8% Fibonacci retracement level, demonstrating the strength of this bullish move. Breaking through the daily Fibonacci retracement level without external positive news is certainly strong enough. Just watch whether Bitcoin closes above 61.8 tomorrow. If it does, patiently wait for Bitcoin to challenge the 1:1 target. If it can't break through, it will likely retrace to the 50 level, corresponding to a price around 91700. Whether it can reach the 1.618 level depends on whether Bitcoin can hold above the 1:1 target. If it holds, it will naturally reach that level; even if it doesn't reach 1.618, it will likely test the 138.2 level. Meeting adjourned.
$BTC
#StrategyIncreaseBitcoinHoldings
{future}(BTCUSDT)