$ETH Evening Strategy:
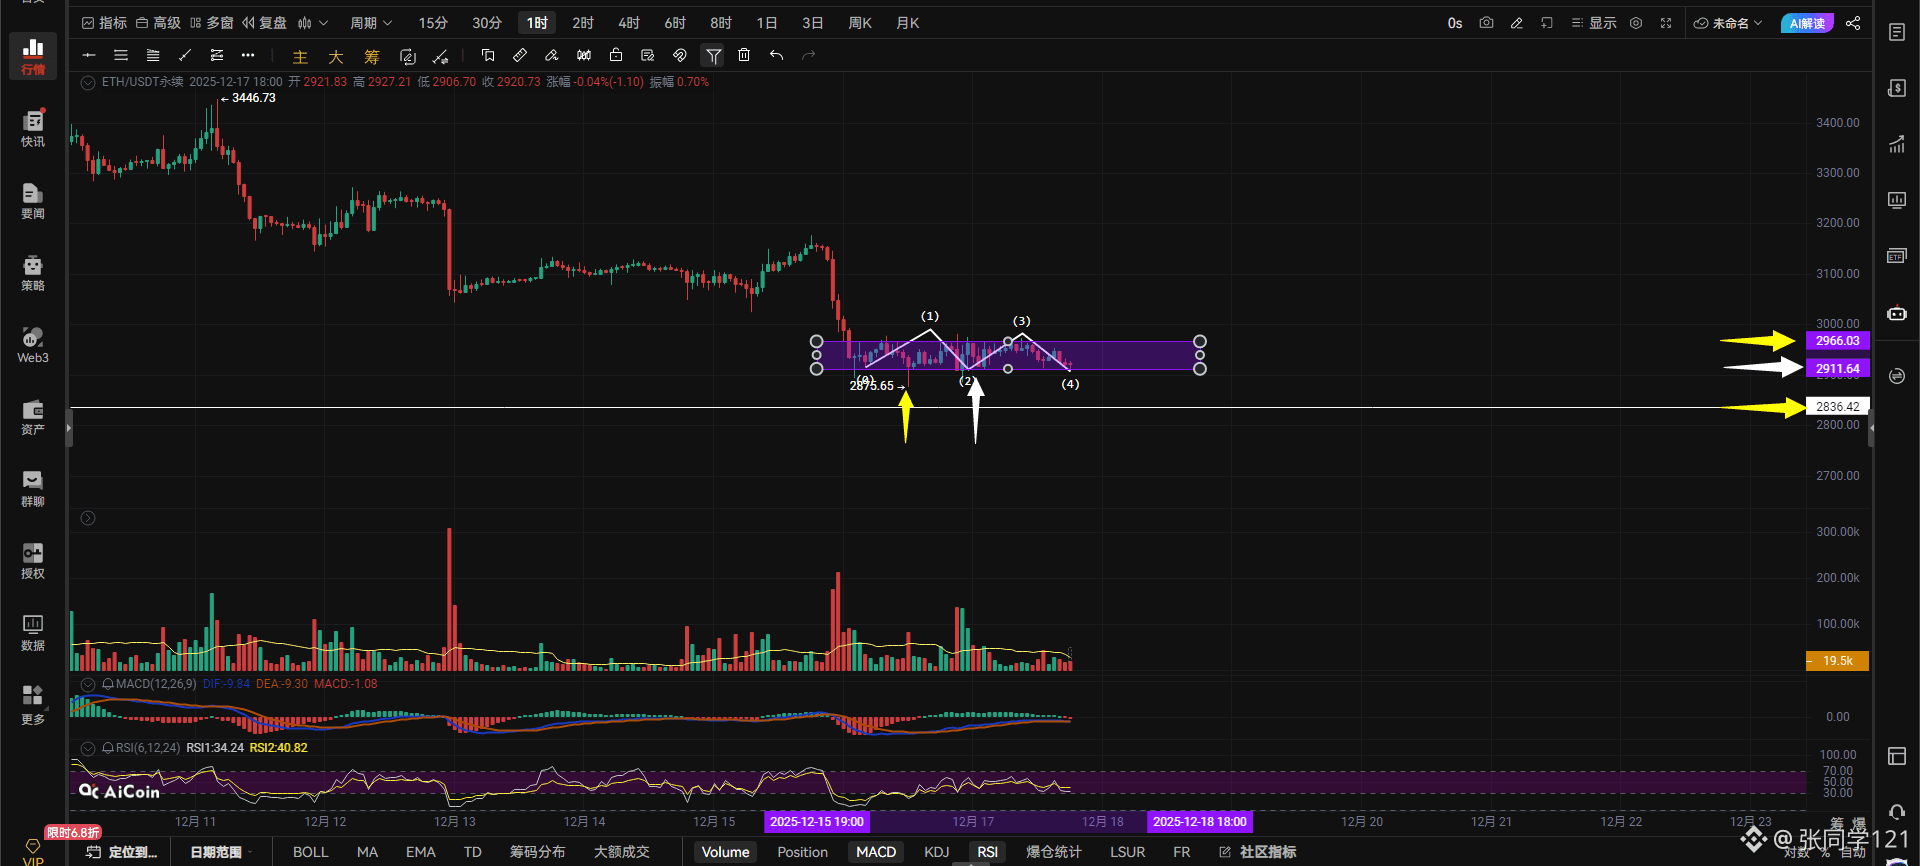
Chart Analysis: Bitcoin (BTC) is really stuck in a consolidation range, with little to no trading opportunity. In this kind of sideways movement, how can you trade? It can't even break out of this range, so what trading space is there? A double top (M-pattern) has formed within the range, with the neckline at the lower boundary of the range at 2911. If it breaks below 2911, the hourly M-pattern is confirmed, and the previous low of 2875 will definitely not hold and will likely test the 2836 area.
Only a breakout or breakdown of the range will give BTC a clear direction. If it doesn't break out or break down, it will continue to oscillate within the range. With such high overlap in the candlestick patterns, there's really no trading opportunity. I hope everyone will refrain from excessive trading in this situation; it's pointless. Patiently wait for it to establish a direction before entering the market.
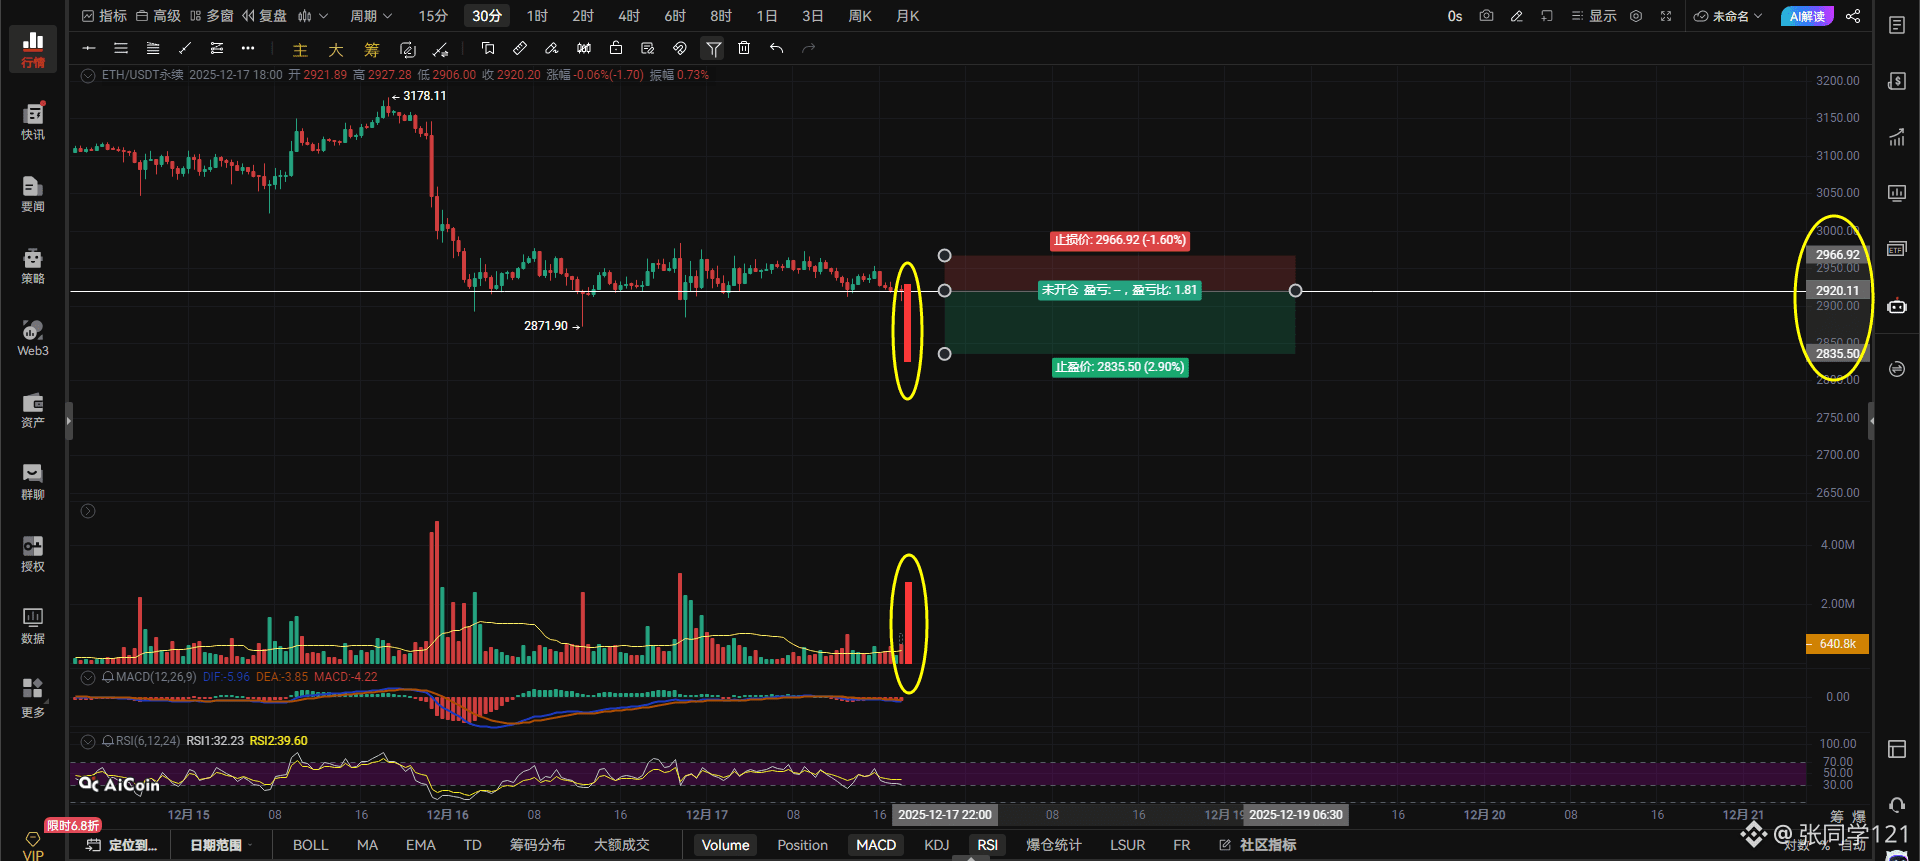
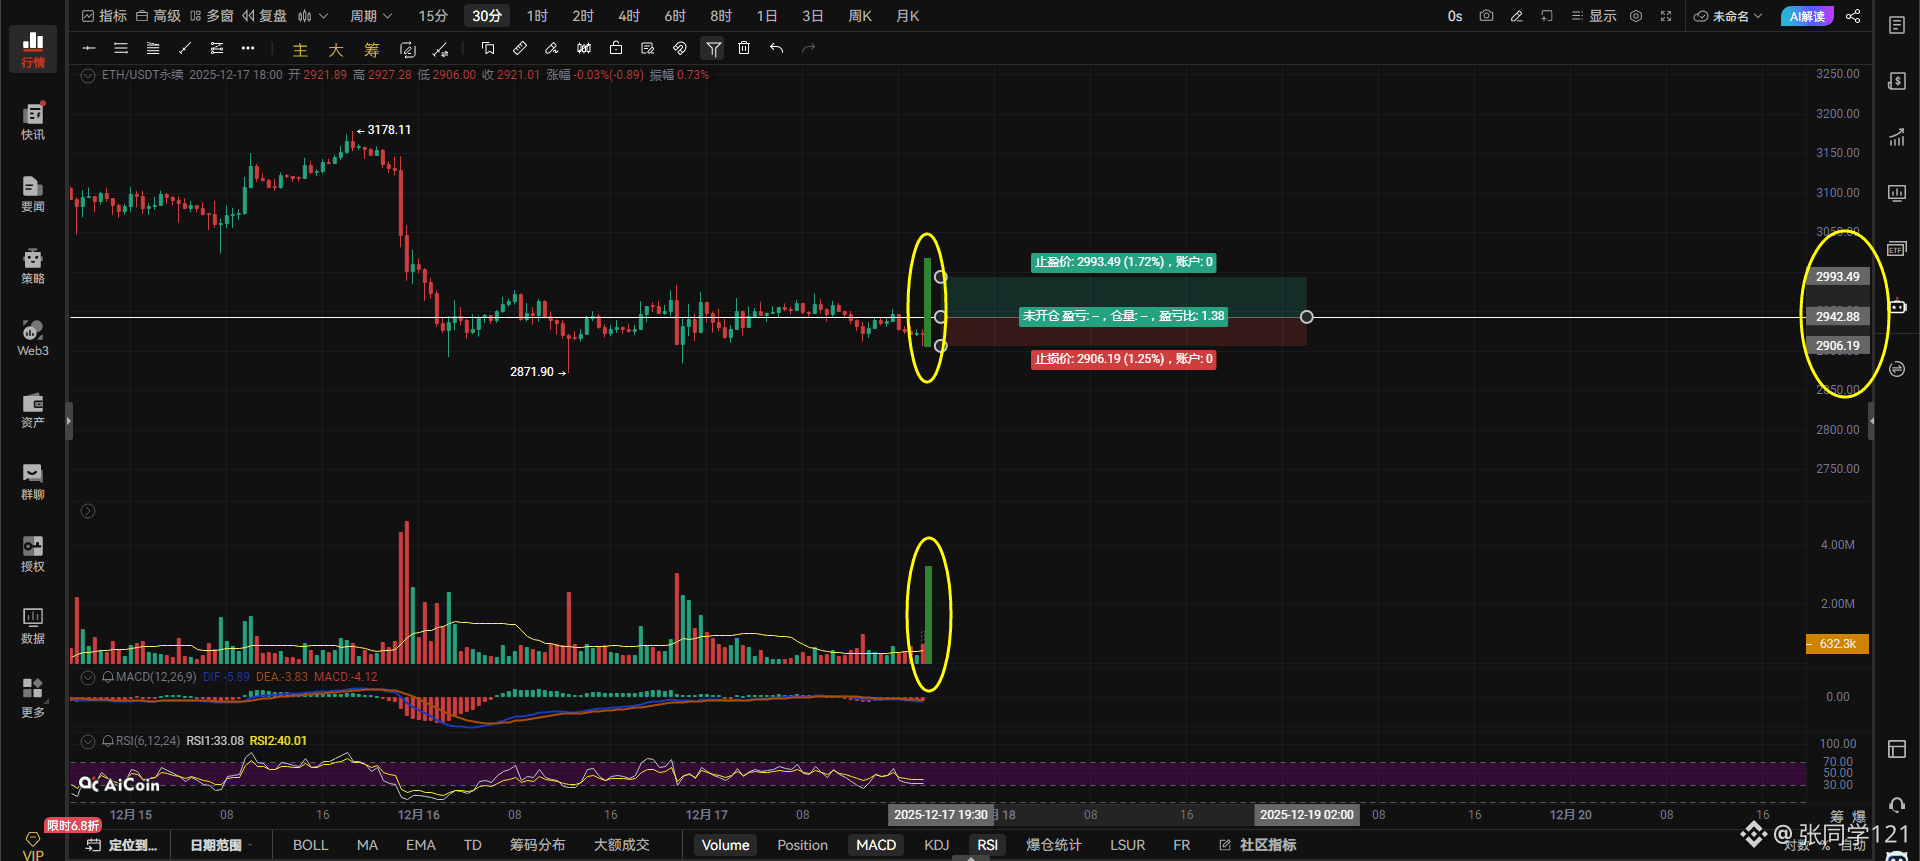
🍅 Buy BTC if it breaks through 2942 with volume; sell BTC if it breaks below 2920 with volume. Pay attention to volume changes and set stop-loss orders.
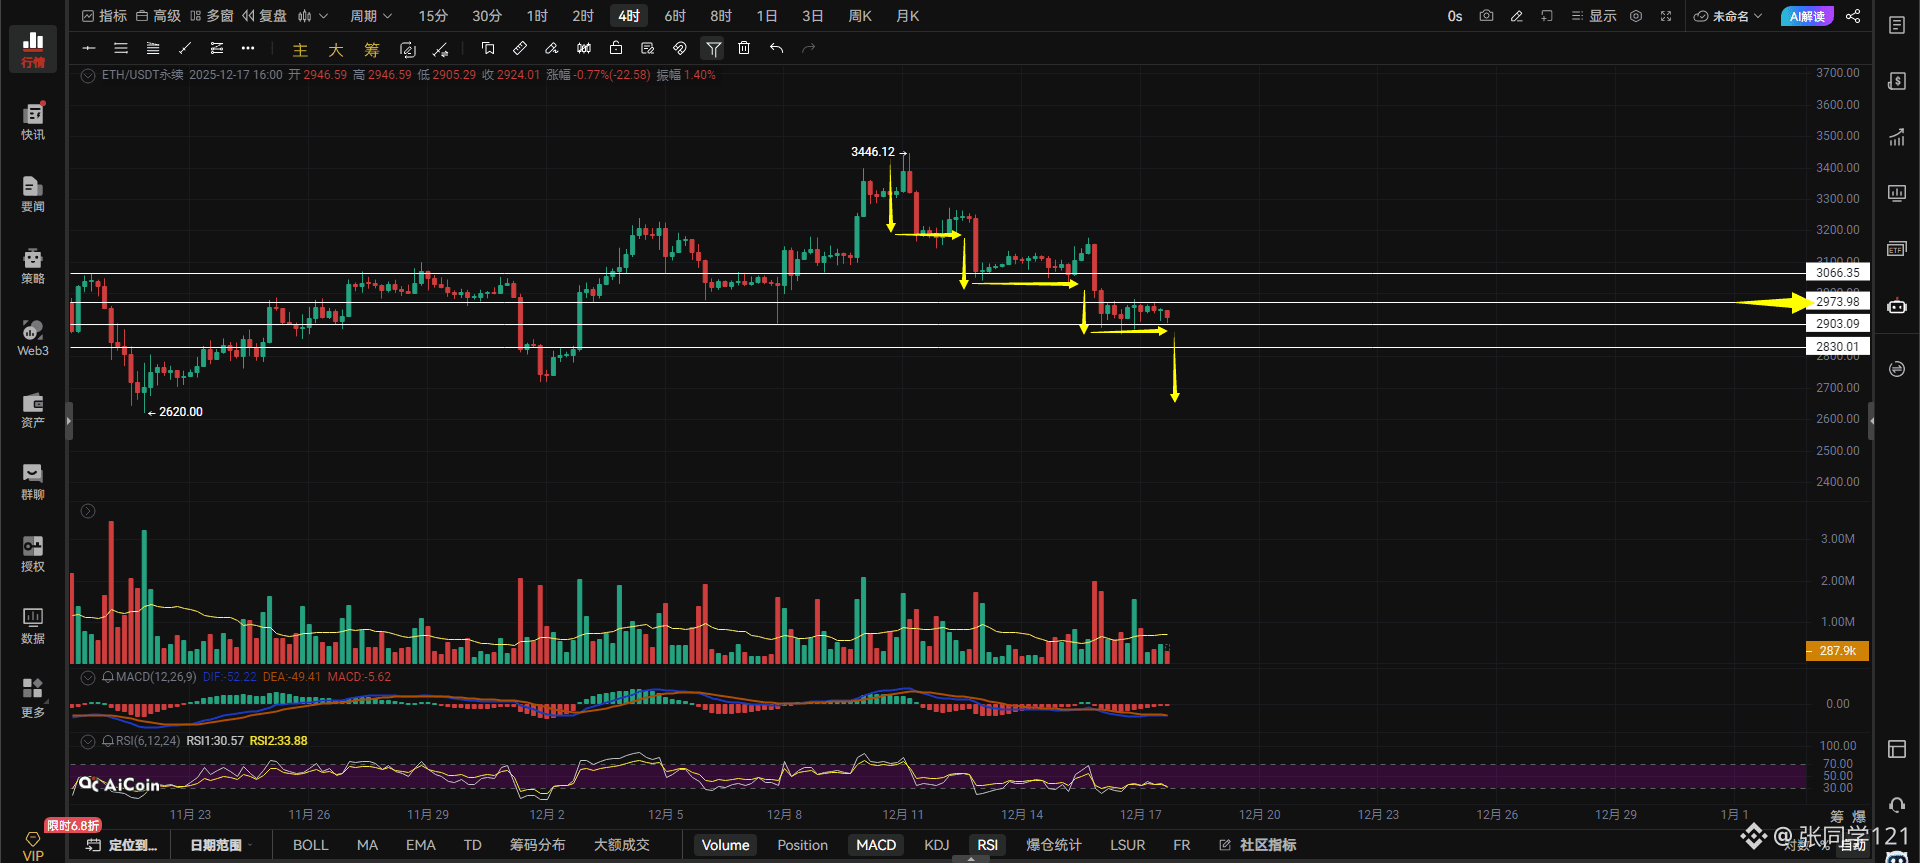
If BTC holds above 2946 on the hourly chart, look for 2975-2994. A break below 2908 on the 4-hour chart would target 2858-2810.
🍅 Looking at the chart again: Bitcoin's 4-hour chart, as indicated by the yellow arrow, shows a pattern of decline followed by consolidation, then further decline, then consolidation again. Will it continue to fall? The answer is yes, it will continue to fall because the market has inertia. It's unclear when this inertia will end, but most retail investors will follow the trend. Unless Bitcoin can hold above 2973 on the 4-hour chart, the decline will not stop; otherwise, further declines are inevitable. Meeting adjourned.
$ETH
#US Non-Farm Payrolls Exceed Expectations
{future}(ETHUSDT)