A fan messaged me asking if the recent surge in SEI and its collaboration with Xiaomi signaled a bullish trend.
Actually, I don't really want to look at these old altcoins. In today's crypto world, not participating in or discussing altcoins is politically correct.
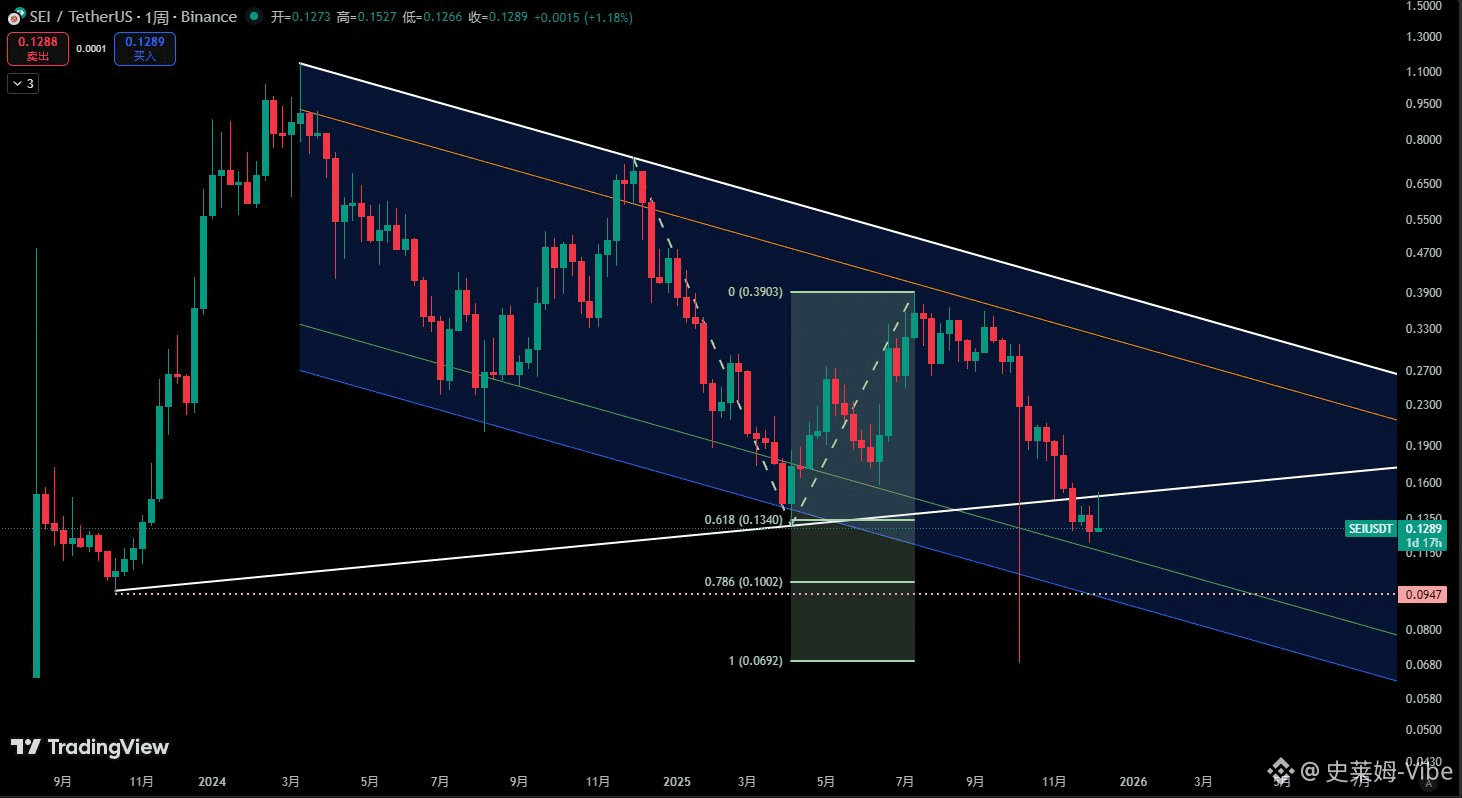
Leaving aside other considerations, let's look at $SEI purely from a chart perspective:
Scenario 1: The chart can be considered a descending channel. Support and a rebound are expected at the lower channel line (between the green and blue lines). Historically, this area has seen multiple instances of stabilization and rebounds, targeting around 0.26. Resistance is seen at the upper orange line.
If it breaks below the lower channel line (green), it may further test the lower channel line (blue) for support, potentially reaching 0.786 Fibonacci retracement, a drop from the October 2023 breakout point, consolidating positions.
Scenario 2: Historically, the price has followed a triangle consolidation pattern. This could be considered a false break below the triangle. Wait for a pullback to the bottom of the triangle before entering, with a target price equal to the opening of the triangle.
Hold on, that's a bullish scenario.