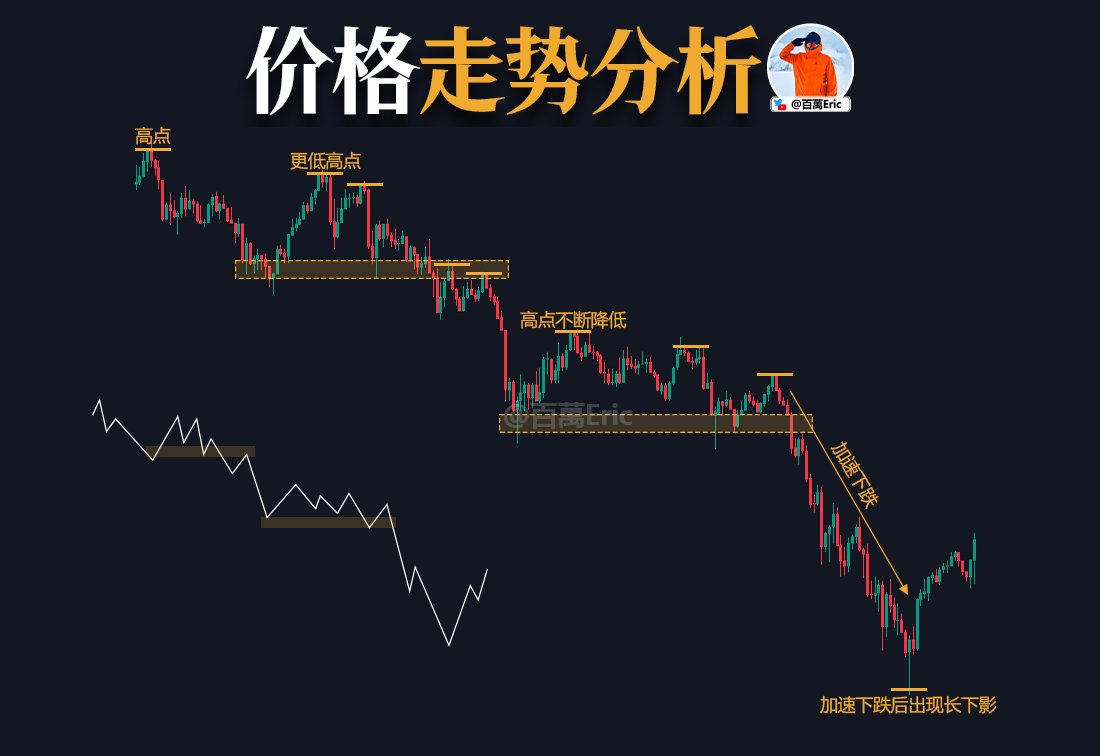
In a downtrend, prices typically follow this pattern:
Lower highs → Support levels repeatedly breached → Narrowing trading range → Accelerated decline.
Each lower high confirms renewed selling pressure.
Each break below support confirms the continuation of the trend.
When a long lower shadow appears for the first time after an accelerated decline, it often indicates weakening selling momentum and the emergence of bargain hunters.
However, this does not necessarily signify a reversal; it only suggests a possible slowdown in the pace.
To determine if a trend has ended, the key is whether the price can regain the highs and lows of the previous wave.
As long as the structure is not broken, the trend remains valid. In other words, use price action to indicate the trend direction, rather than as a percentage of price movement.