The essence of pattern trading is never prediction, but confirmation.
All strategies begin with the premise that the market has already made its stance clear, entering with the trend rather than trying to guess tops and bottoms.
I. Breakout Strategy: New Structure Emerges
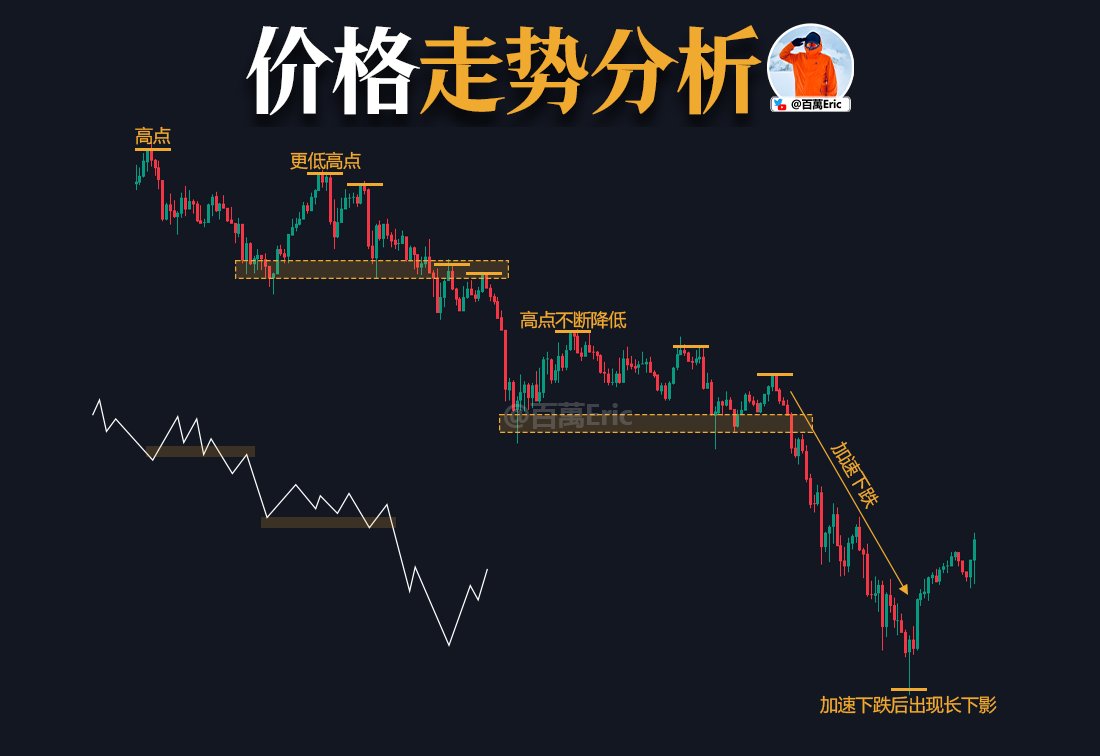
When the price breaks through the previous high or falls below support, it signifies a disruption of the existing balance and a clear shift in direction. Whether going long or short, the essence is trading the "completion of the shift in bullish and bearish forces." These signals are usually accompanied by increased volume, acceleration, and strong market sentiment (it's too late to get on board now, or it's the last chance to escape 😂).
II. Reversal Strategy: From One-Sided to Two-Sided Trend
If the price moves in a one-sided direction, it indicates that the market is still being pushed. However, if it starts to change, with highs failing to break through and lows failing to rise, coupled with frequent suppression at key levels, it's basically confirmed that the market momentum is waning.
This structural stagnation marks the end of the "foolish market": the market no longer rewards simple trend following, forcing shorter holding periods and increasing the difficulty of trading. At this point, continuing to rely on trend-following thinking will lead to frequent losses, while the real trading advantage shifts to the ability to anticipate structural shifts and switch rhythms.
III. Pullback Strategy: Reconfirmation After a Trend Establishment
After a strong breakout, prices often pull back to the old structural levels. This is a structural pullback in the market, testing the stability of the trend and providing a low-risk re-entry opportunity for those who missed the initial move. The key is to judge the "strength" and "rhythm" of the pullback, rather than blindly buying on every pullback.
*The breakout pullback test is the most suitable strategy for trading beginners.
IV. Moving Average Strategy: Resonance Signals of Time Structures
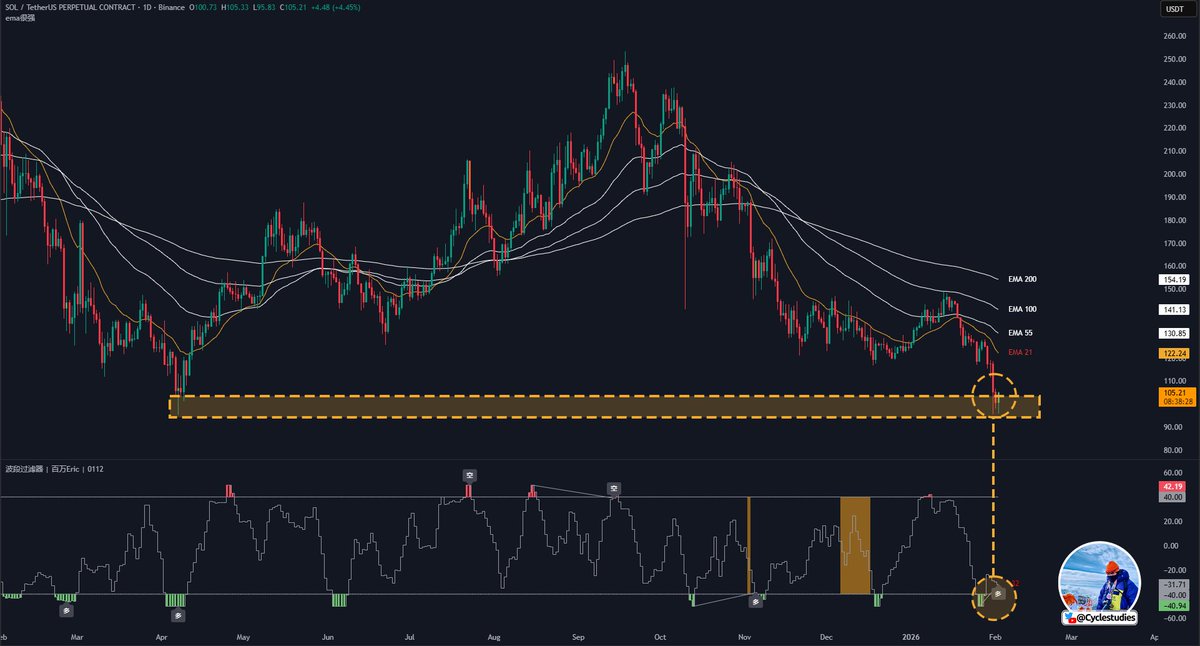
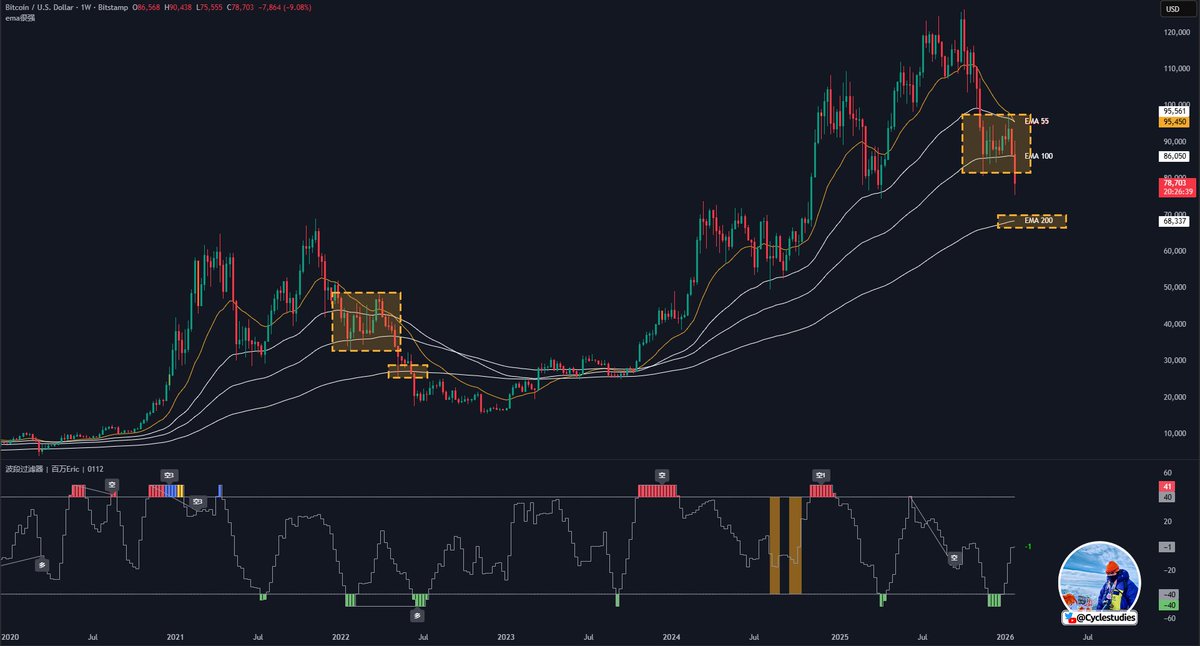
When a short-term moving average crosses above a long-term moving average (e.g., EMA50 crosses above EMA200), it represents multi-timeframe resonance, indicating continued trend strength; conversely, the opposite is also true.
Moving averages do not predict signals; they only verify that a trend already exists (an objective standard). They are slow, but they filter out much of the noise from abnormal price fluctuations.
The maturity of trading lies not in whether you are bullish or bearish or in improving your so-called accuracy, but in your ability to identify price structures that suit your trading style and, based on existing facts, execute a repeatable reaction logic.