Support and resistance are not simply two lines drawn on a chart.
They are the collective consensus formed by the market over time, psychological anchors (and market consensus) after short-term clashes between bulls and bears.
A support zone is the buyer's bottom line. Multiple touches without a break indicate active defense by bulls, and the market recognizes this as a reasonable low range.
However, once effectively broken, this zone transforms from a "defense line" into a "resistance zone," triggering stop-loss orders and short selling simultaneously, leading to a market reversal.
A resistance zone is the seller's ceiling. Multiple failed attempts to break through represent continued bearish pressure. However, once broken, it indicates that supply has been absorbed, bulls have gained control, and the original resistance transforms into new support.
Therefore, the key is not where the "lines" are drawn, but whether price behavior within these zones indicates a shift in power.
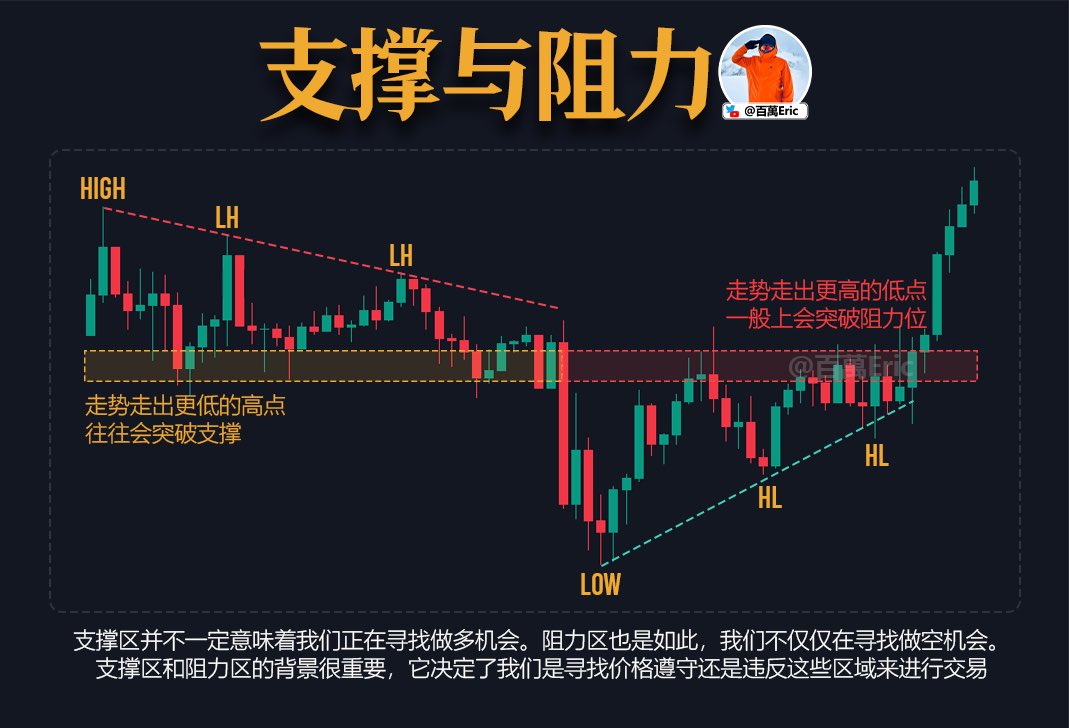
When you see prices forming higher lows in support zones (important), or lower highs in resistance zones (important), it is often a signal of a trend reversal.