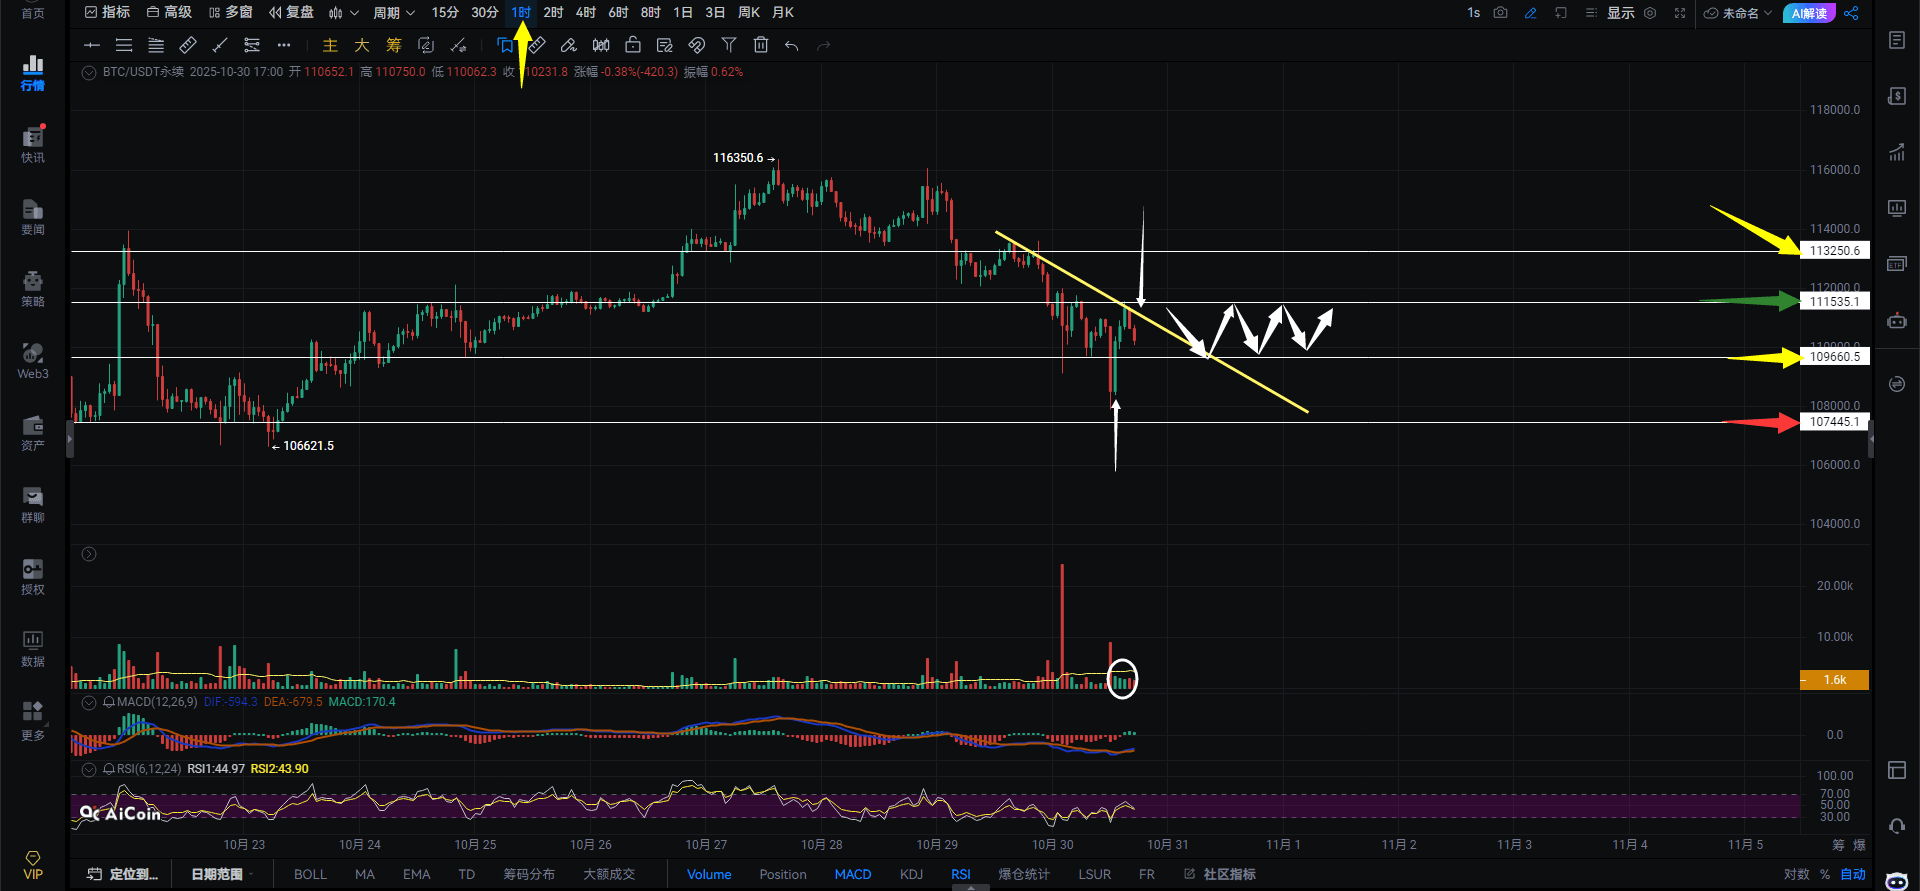
ETH Evening Strategy: Chart Analysis: The pattern shown on the hourly chart for Bitcoin (BTC) is a bullish flag pattern. As long as it doesn't break below this pattern, BTC won't continue its decline and may test the lows of the two lower spikes indicated by the white arrows. The closing price should not close below 3862.
If it breaks below 3862, it will continue its decline towards 3709, forming a double bottom pattern on the hourly chart, with the lower spike potentially reaching 3705 (indicated by the yellow arrow). It will then consolidate before choosing a direction. A break above the bullish flag pattern to above 3970 is needed for BTC to stop its decline on the hourly chart. Otherwise, the probability of breaking below the bullish flag pattern is higher than the probability of breaking it. This is from an hourly chart perspective.
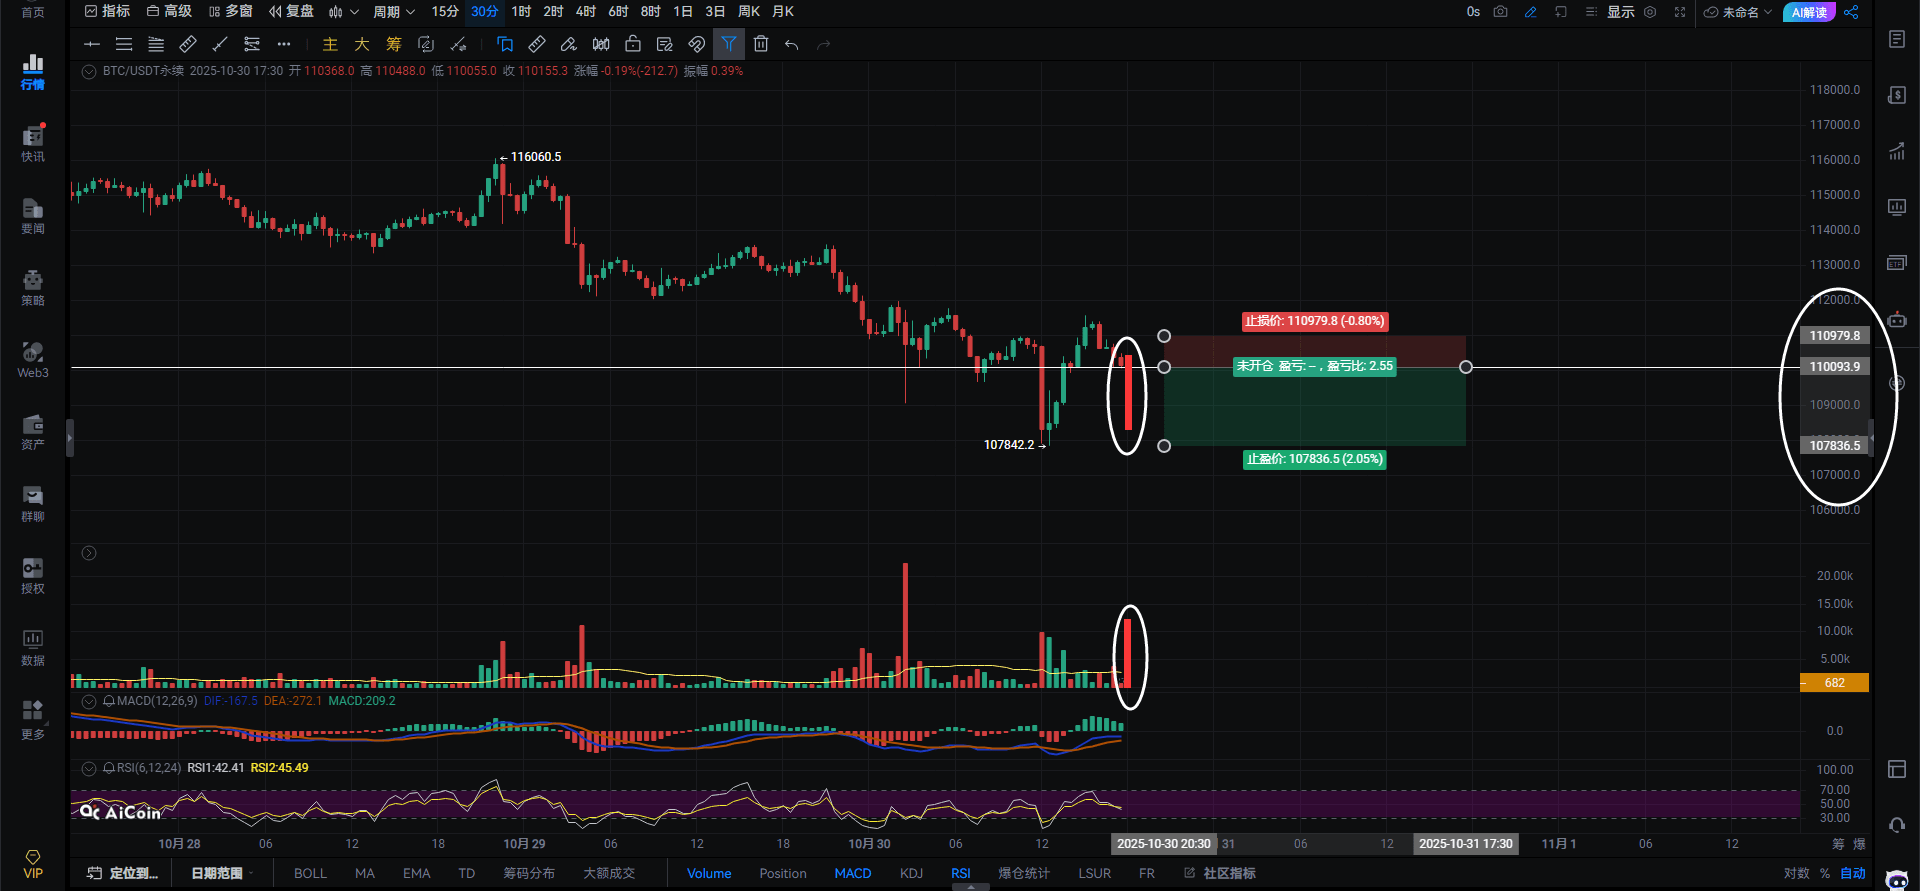
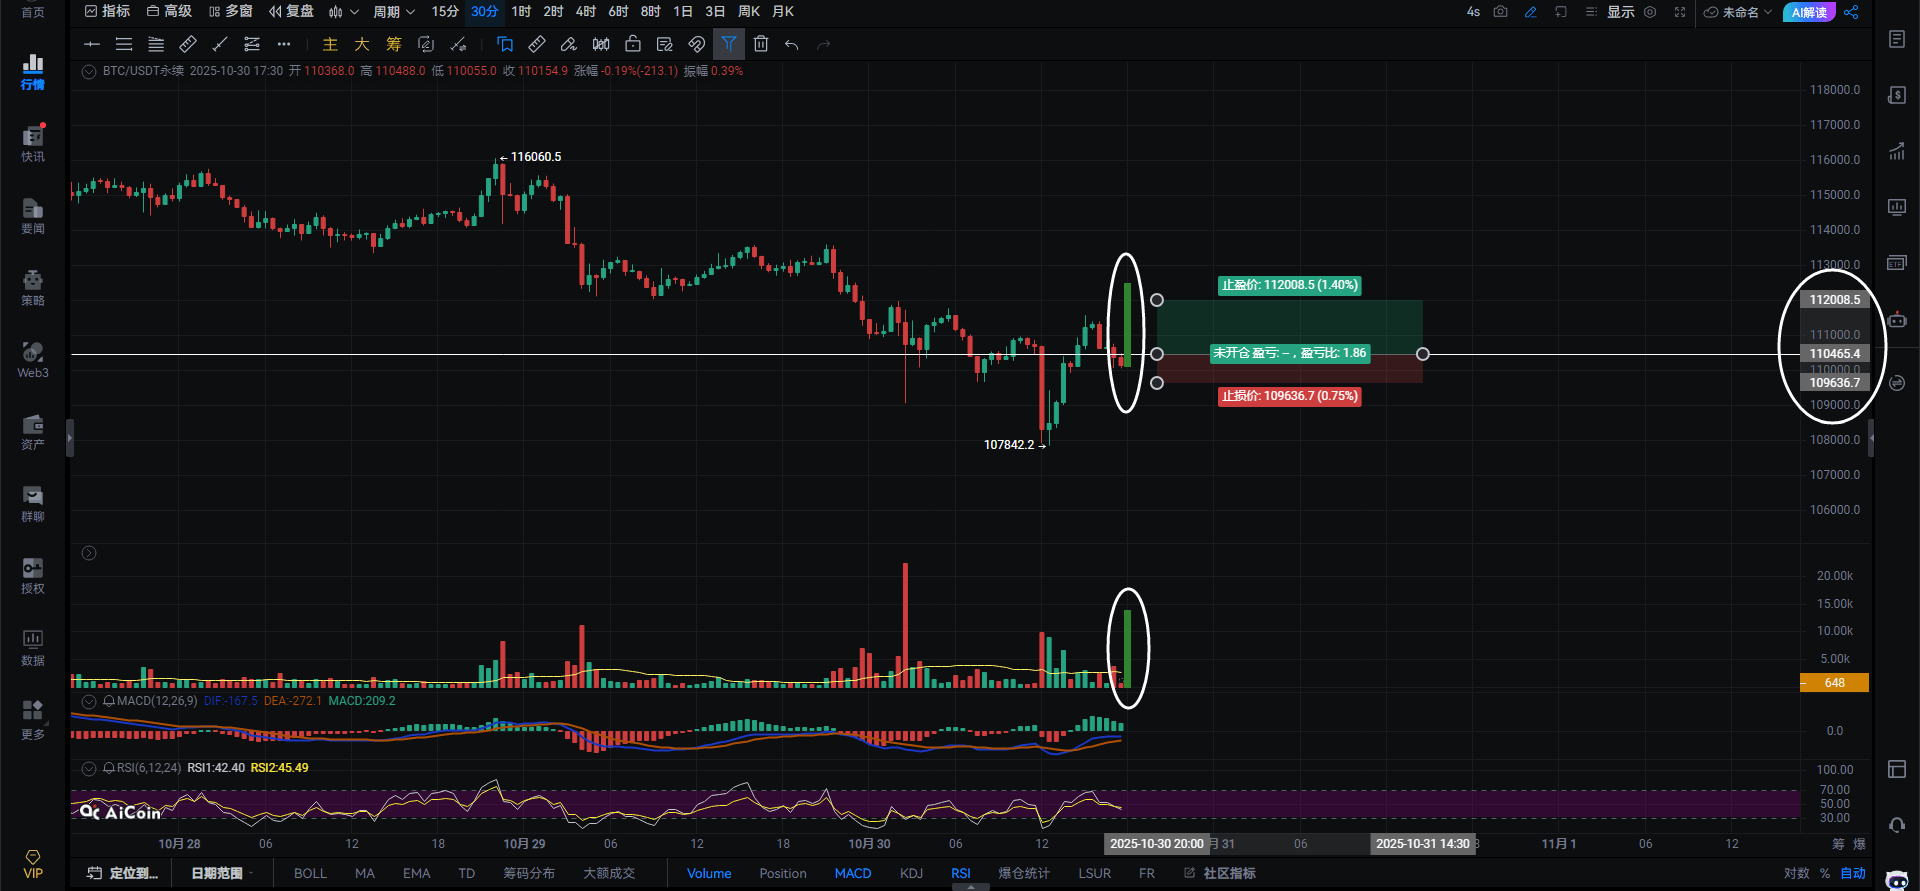
🍌 A breakout above 3906 with volume suggests a short-term long position. A break below 3886 with volume followed by a failed rebound suggests a short position. Use stop-loss orders.
If BTC holds above 3948 on the hourly chart, the upside target is 4008-4035. Failure to break above 3948 will limit the upward momentum.
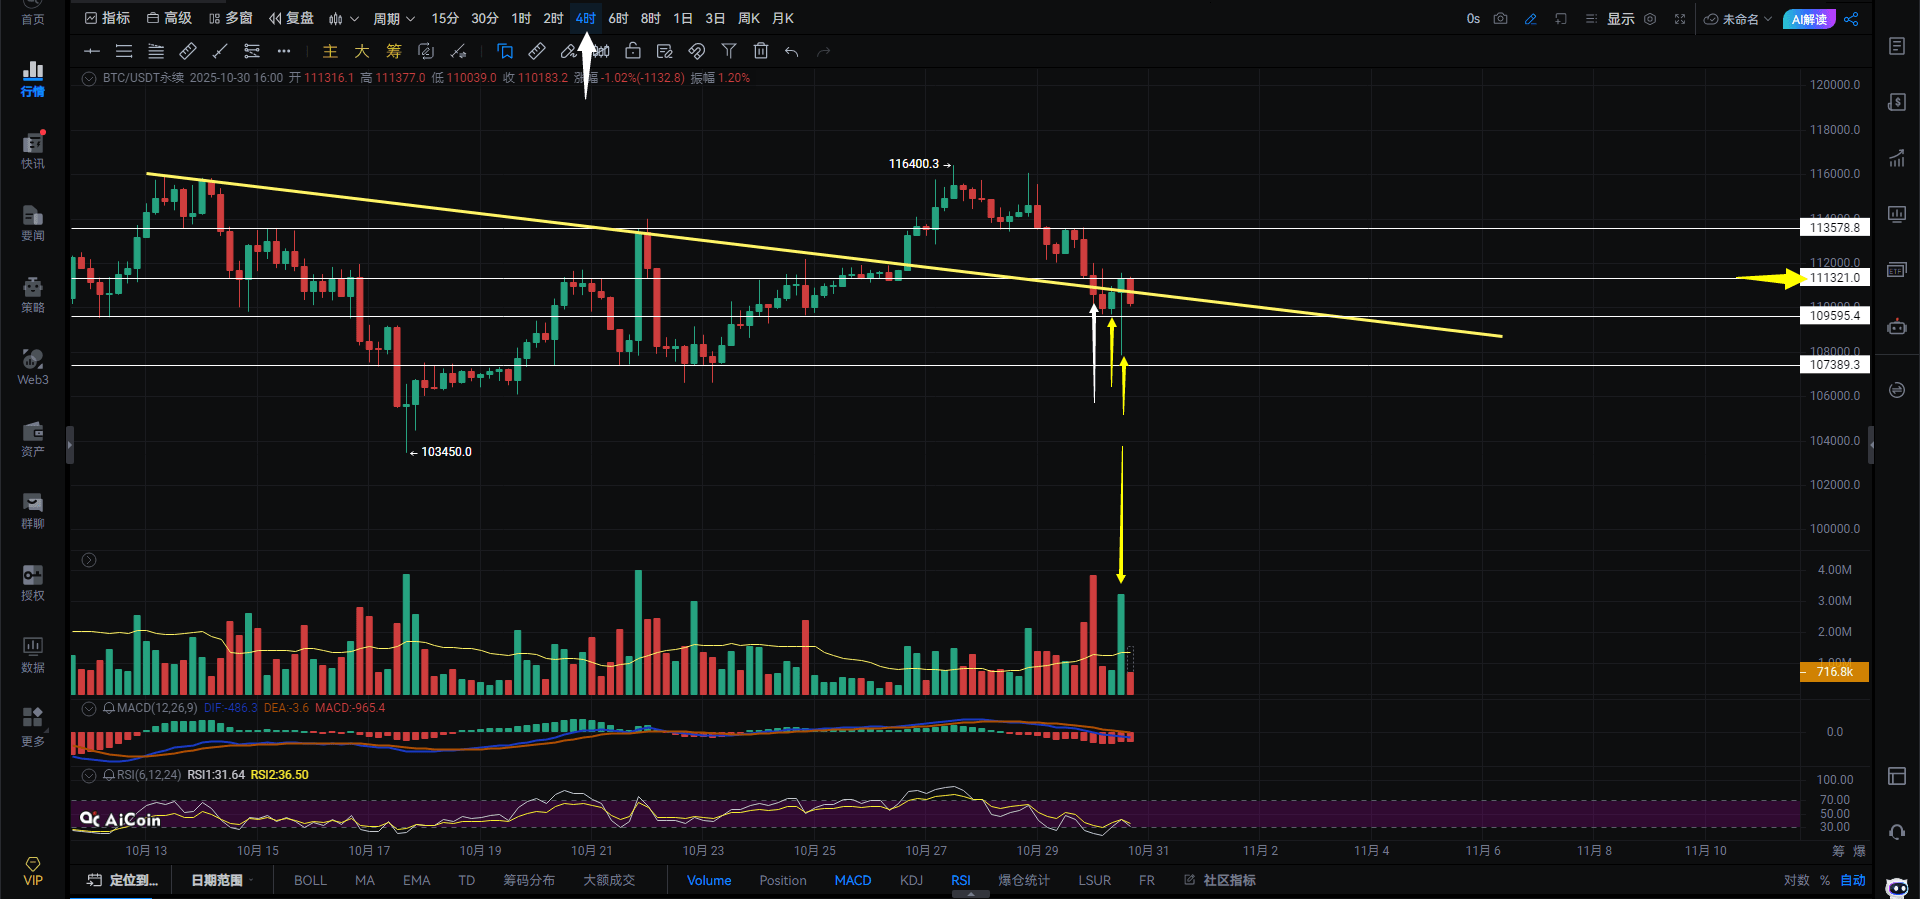
A break below 3835 on the 4-hour chart would target 3762-3709. A break below 3835 would essentially seal the fate of Bitcoin.
Continuing with the chart: The neckline on the daily chart for Bitcoin is 3831. If the daily closing price is below 3831, you can expect to see a move towards 3682, indicated by the red arrow. A further panic sell-off could push it back to 3345. However, reaching 3345 wouldn't necessarily be a bad thing. Why? Because a pullback to 3345 would form a multiple bottom on the daily chart, indicated by the yellow arrow. A multiple bottom on the daily chart would lead to a more stable and longer-lasting upward trend compared to the current double bottom pattern. This is from a daily chart perspective. Pay attention to volume changes. Meeting adjourned.
$ETH
#Fed Rate Cut
{future}(ETHUSDT)