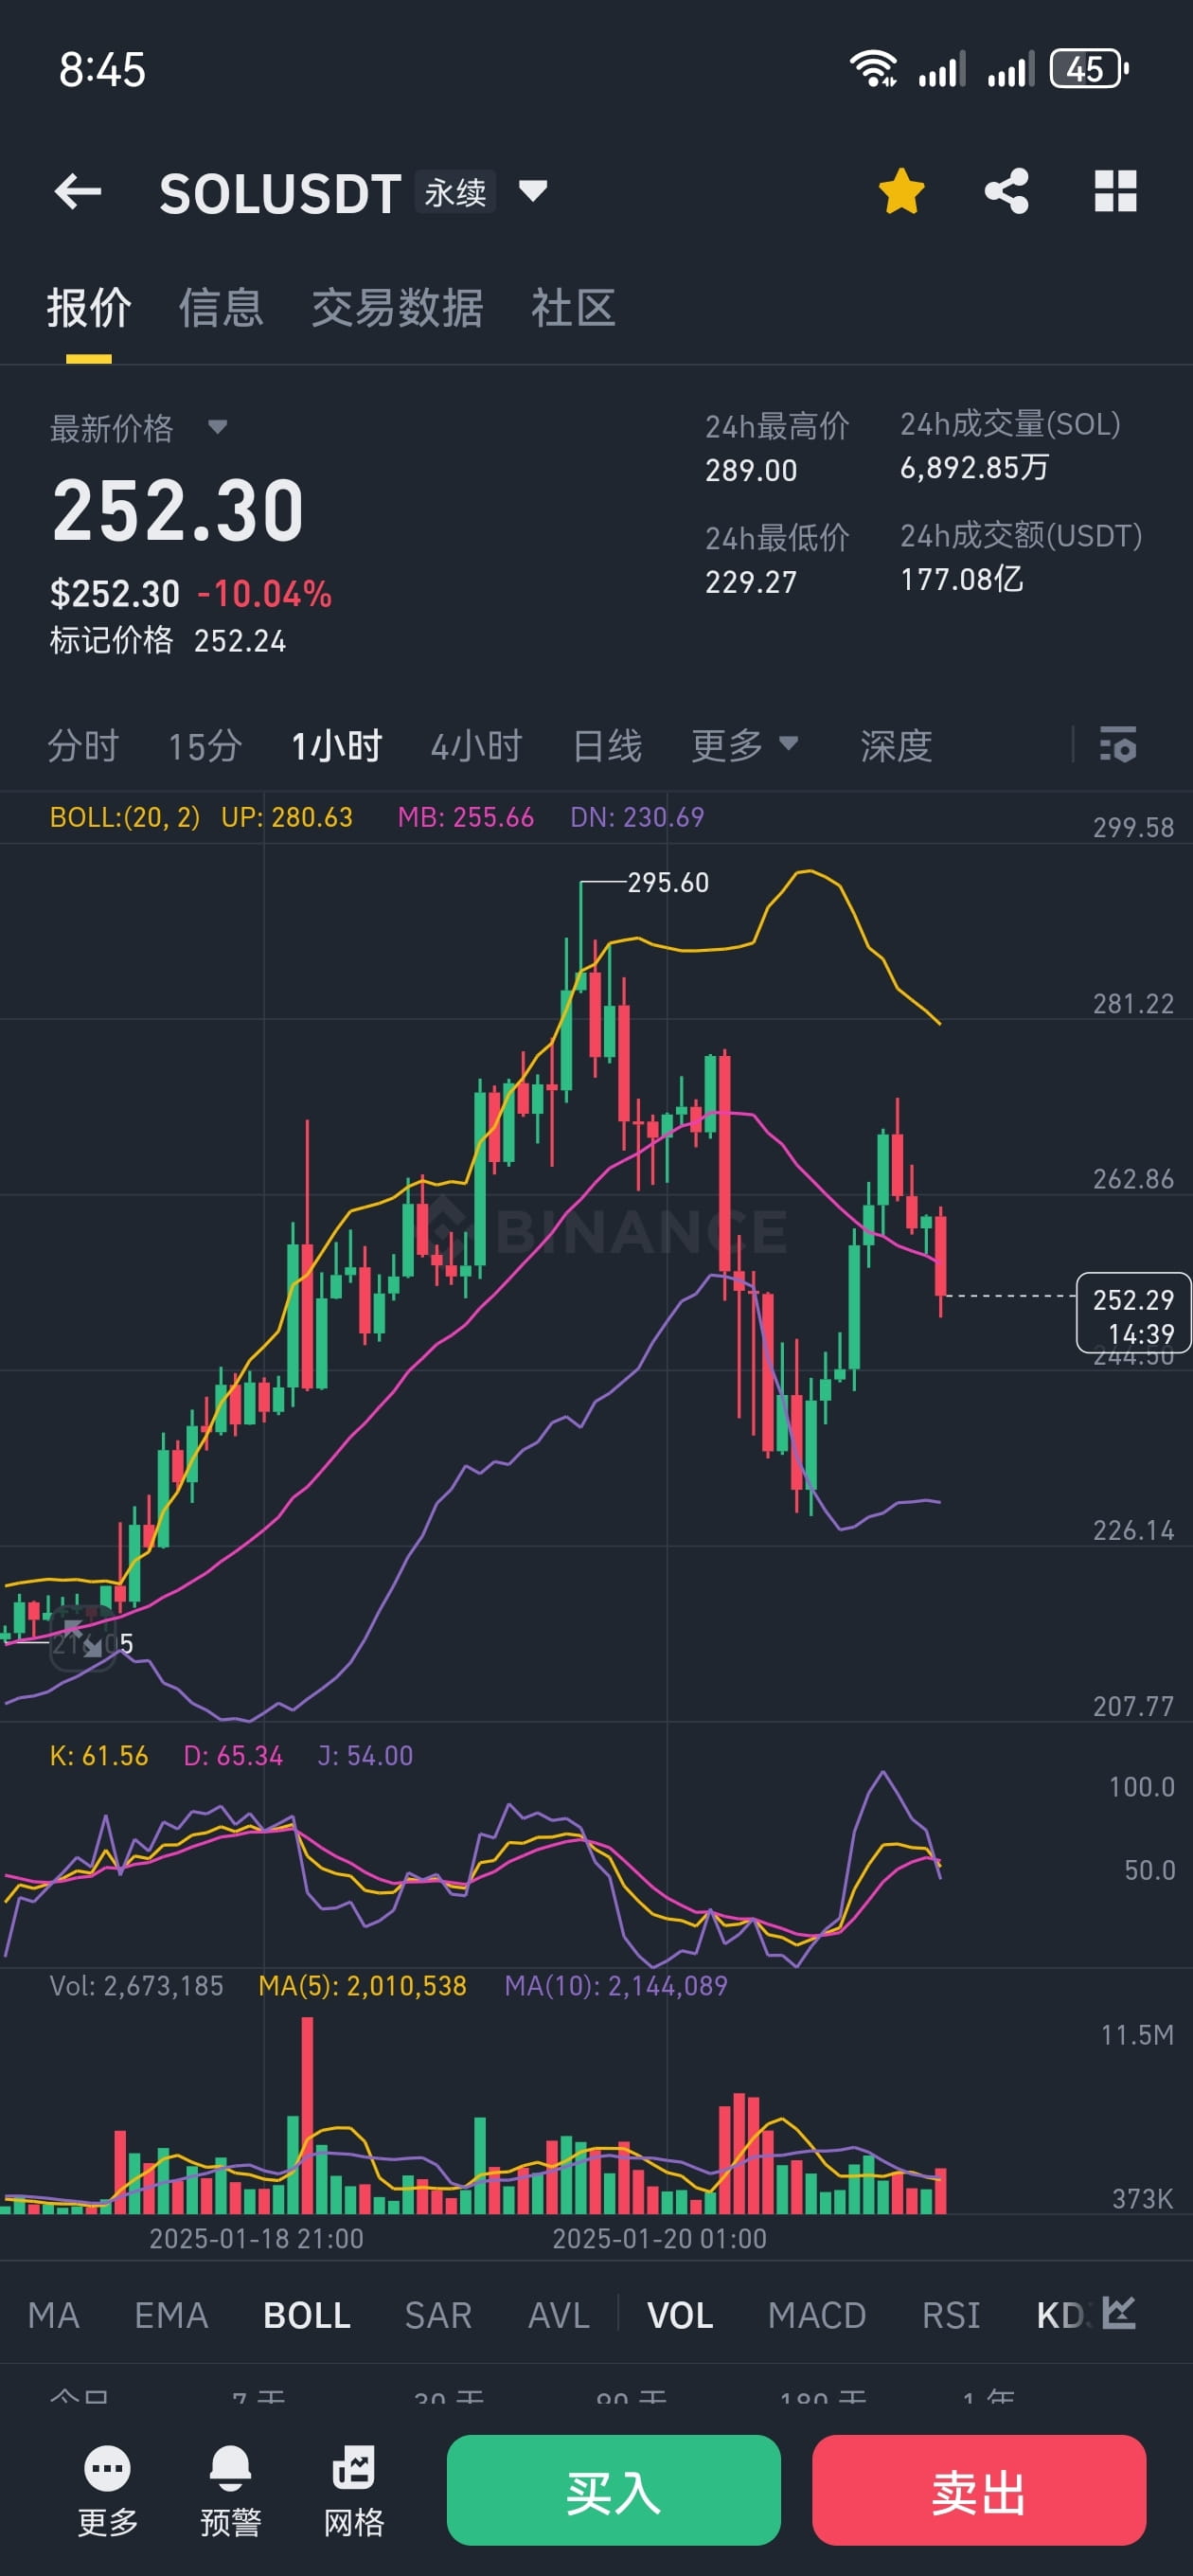
15136.After experiencing a period of upward trend, SOL has shown a significant pullback. The current candlestick has fallen below the middle band of the Bollinger Bands at $255.66 and is approaching the lower band at $230.69. This indicates that the market sentiment is relatively pessimistic in the short term and there is significant selling pressure.The K and D values of the random indicator (KDJ) are both above 60, but the J value has dropped to 54, indicating that the market may be in a pullback stage after overbought. Usually, when the K and D values are above 80, the market is considered overbought and a pullback may occur. Although the current value has not yet reached the overbought range, the decrease in J value indicates that there may be further downward pressure in the short term.In terms of trading volume, the recent hour's trading volume was 2673185 SOL, higher than MA (5)'s 2010538 and MA (10)'s 2144089, indicating that the current decline is accompanied by high trading volume and active selling.Based on this information, the price may continue to test the support level of $230 in the short term. If this support level can effectively support the price, there may be a rebound, retest the mid track at $255.66. However, if the support level of $230 is effectively breached, the price may further drop to $220 or even lower.12 hour forecast: Prices may fluctuate within the $230-250 range, seeking support.24-hour forecast: If the support level of $230 is effective, the price may rebound to the range of $250-260. If the support level is breached, the price may drop to $220.48 hour forecast: If market sentiment improves, prices may gradually rebound to the $260-270 range. However, if the market continues to weaken, prices may consolidate within the $220-230 range.Only represents personal opinions and does not provide investment advice.What will happen to the market after Trump's inauguration?