Price Converter
  • Crypto
  • Fiat
USD美元
CNY人民币
JPY日元
HKD港币
THB泰铢
GBP英镑
EUR欧元
AUD澳元
TWD新台币
KRW韩元
PHP菲律宾比索
AED阿联酋迪拉姆
CAD加拿大元
MYR马来西亚林吉特
MOP澳门币
NZD新西兰元
CHF瑞士法郎
CZK捷克克朗
DKK丹麦克朗
IDR印尼卢比
LKR斯里兰卡卢比
NOK挪威克朗
QAR卡塔尔里亚尔
RUB俄罗斯卢布
SGD新加坡元
SEK瑞典克朗
VND越南盾
ZAR南非兰特
No more data
menulogo
search
Index/List/Details
币市雷达_CopyTrading_cc
币圈小白
2024-12-09 11:44
Follow
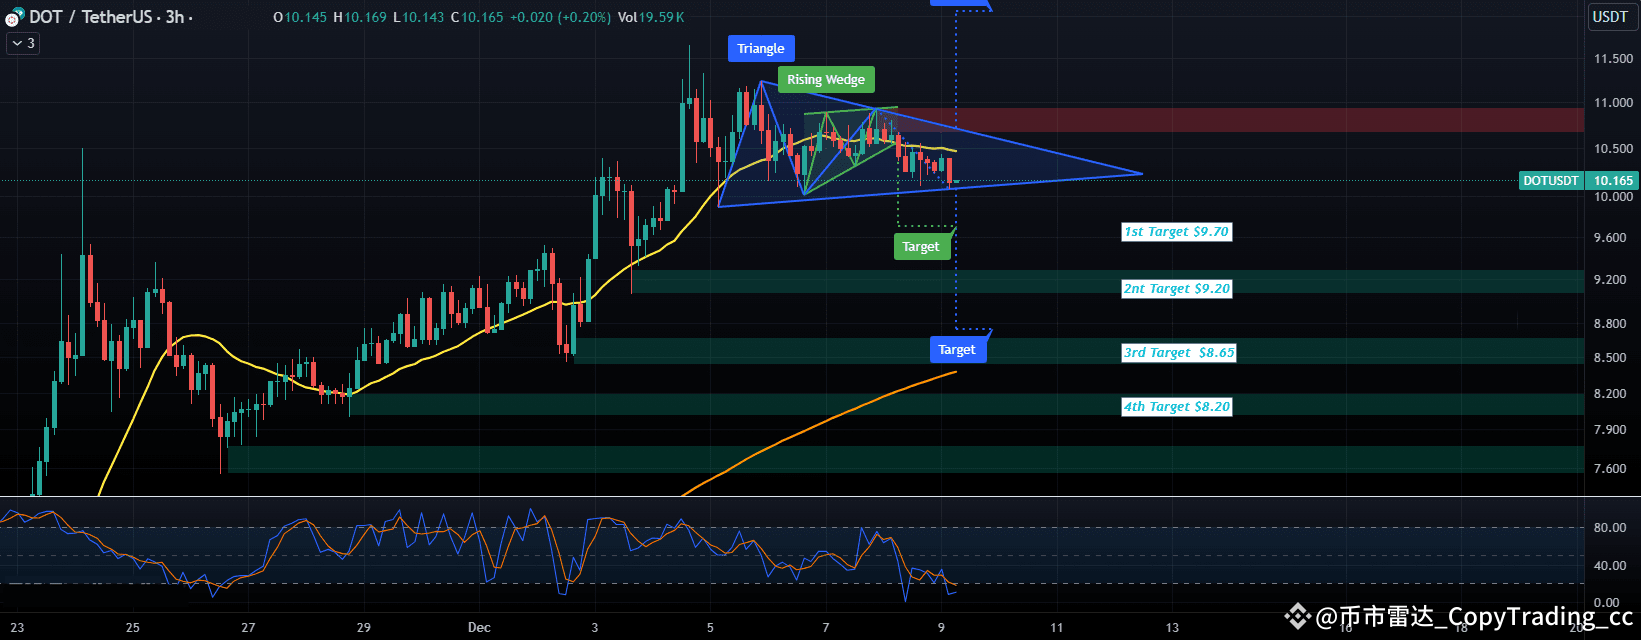
Big Shot Opinion: Watch More $DOTPolkadot (DOT) forms a triangular shape on the 3-hour chart, and traders should closely monitor this shape to find possible breakthrough signals.Support level: If the triangular shape breaks through the downward trend, you may see DOT testing at the following support levels: $9.70/$9.20; Further downward movement may test the $8.65, $8.20, and even $7.50 regions.If it is confirmed to break through the downward trend of the triangle, this may be a short-term bearish signal, and short selling can be considered. On the contrary, if DOT reaches these low support ranges, it may be a good buying opportunity for investors seeking long-term appreciation# Content mining, follow me! Get more expert opinions!
Your browser does not support the video tag.
Icon挖矿
DOT
-1.23%
POL
-3.23%
T
Risk and Disclaimer:The content shared by the author represents only their personal views and does not reflect the position of CoinWorldNet (币界网). CoinWorldNet does not guarantee the truthfulness, accuracy, or originality of the content. This article does not constitute an offer, solicitation, invitation, recommendation, or advice to buy or sell any investment products or make any investment decisions
0
39
0
31
0
No Comments
edit
comment
collection
like
share