


Author:Sky Walker
Aave (AAVE) rises slightly to trade at around $179 at the time of writing on Tuesday. Bulls are extending the four-day recovery that began from the $147 support level established on Friday.
A daily close above $180 would affirm the bullish grip and increase the chances of a breakout toward $200. However, holding below the immediate resistance could shift the trend bearishly toward support at $147.
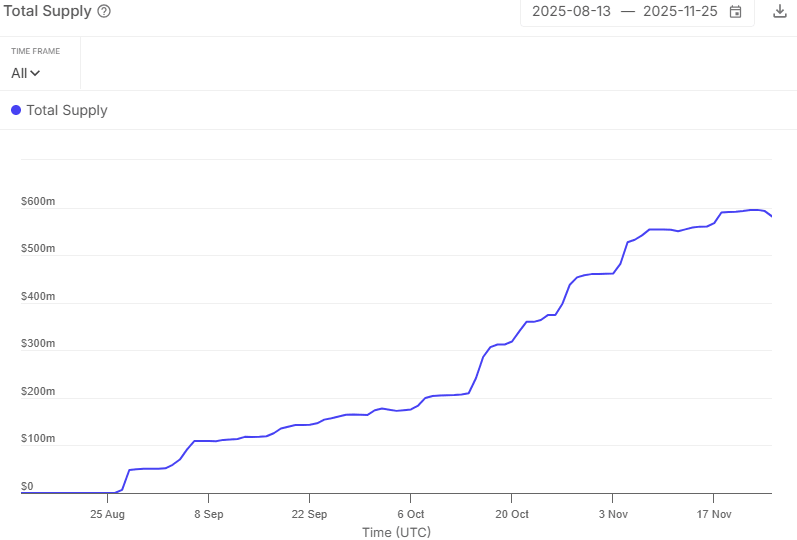
Aave RWA lending activity accelerates
The total supply on the Aave Horizon real-world assets (RWA) market has been climbing steadily since its debut in August. According to Sentora, the lending market supply stands at $581 million, representing a 56% MoM increase.
RWA is one of the crypto industry’s fastest-growing sectors, with some projects backed by leading fund managers like BlackRock. This sector involves the tokenization of real-world assets, including equities and real estate. Lending markets like Aave’s Horizon are gaining traction, suggesting demand for RWA products could reach new heights.
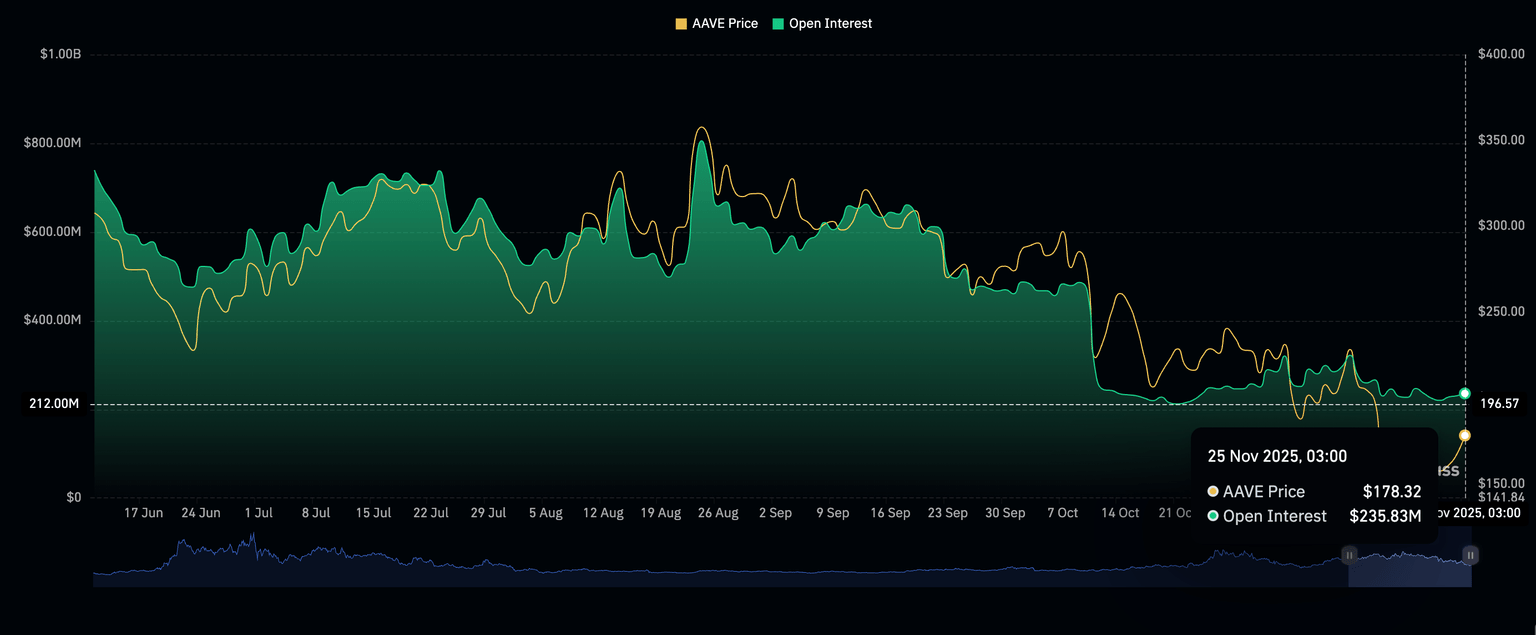
Meanwhile, retail interest in AAVE remains relatively low, as evidenced by a weak derivatives market. CoinGlass data shows futures Open Interest (OI) averaging $236 million on Tuesday, down from $322 million on November 11 and the record high of $806 million on August 24.
OI must maintain a steady uptrend to support positive market sentiment, which encourages investors to increase their risk exposure. This creates a health environment that tends to sustain gains.
Technical outlook: Aave faces downtrend pressure
Aave is trading at around $178 at the time of writing on Tuesday, weighed down back low retail demand and risk-off sentiment in the broader cryptocurrency market. The 50-day Exponential Moving Average (EMA) at $210, 100-day EMA at $235 and 200-day EMA at $245 slope lower and sit above the AAVE price, reinforcing a bearish medium-term bias.
A close above the 50-day EMA could ease immediate pressure. The Moving Average Convergence Divergence (MACD) indicator line has crossed above the signal line, with the positive histogram widening, suggesting strengthening bullish momentum. The Relative Strength Index (RSI) stands at 43 (neutral), edging higher but still below the 50 midline.
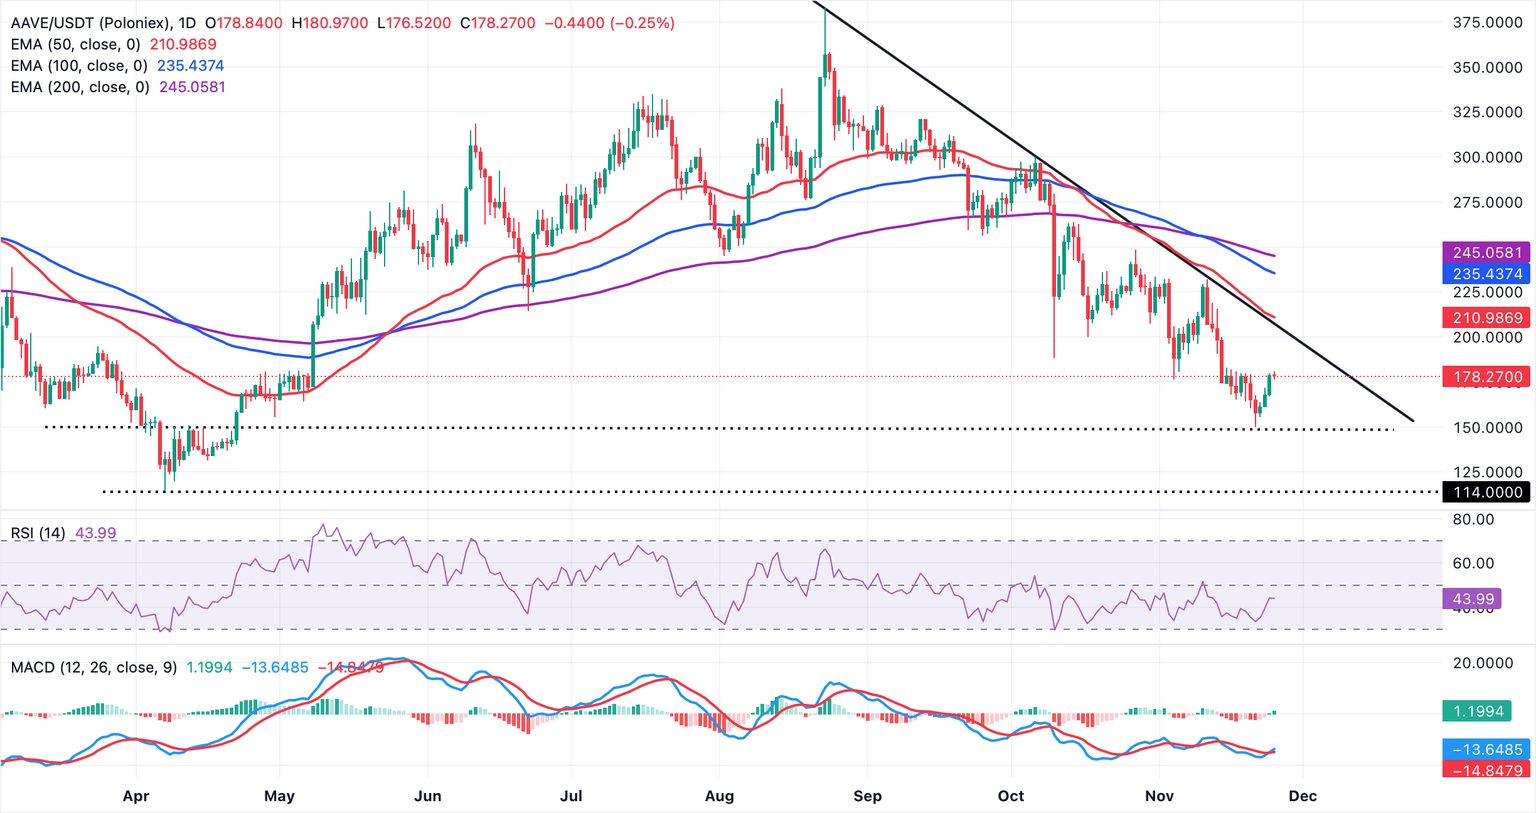
The descending trend line from $391 limits gains, with resistance seen at $206. A breakout would open a recovery toward the 50-day EMA at $210, while subsequent advances could face the 100-day EMA at $235. If capped below the trend barrier, the token would remain pressured beneath the declining moving averages, keeping sellers in control despite improving momentum signals.
(The technical analysis of this story was written with the help of an AI tool)


No Comments