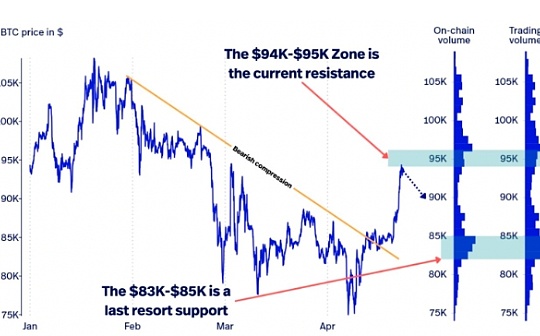
In Bitcoin investing, determining whether the market is "overvalued" or "undervalued" is critical. The MVRV Ratio (Market Value to Realized Value) is a core tool that compares Bitcoin’s market value (current price) with its realized value (historical on-chain transaction costs), helping investors identify turning points.

1. What is MVRV?
The formula for MVRV is:
MVRV = Market Cap (MV) / Realized Value (RV)
Market Cap (MV): Current Bitcoin price × circulating supply.
Realized Value (RV): Sum of the last transacted price for all Bitcoin.
In simple terms, RV reflects the average cost basis of investors, while MVRV measures how far the current price deviates from this baseline. For example:
MVRV > 3: Market is overheated, prices are significantly above average cost, indicating a potential correction.
MVRV < 1: Prices are below average cost, signaling a possible buying opportunity.
2. Practical Applications of MVRV
Identifying Market Cycles
Bull Market Signals: MVRV consistently above 1.5. A break above 3 may indicate a bubble (e.g., March 2025 when MVRV-Z hit 3, followed by a BTC drop from $70K).
Bear Market Bottoms: Prolonged MVRV below 1 often marks historical lows (e.g., late 2023 bear market with MVRV below 0.8).

Combining with Other Indicators
RSI (Relative Strength Index): Strong sell signals emerge if MVRV is high and RSI is overbought (>70).
NVT (Network Value to Transactions): Validates speculative excess.
Dynamic Strategy Adjustments
Reduce exposure when MVRV rises rapidly; accumulate in undervalued zones.
3. Key Considerations
Historical Limitations: MVRV relies on past patterns—always contextualize with macro trends (e.g., regulations, liquidity).
Short-Term Noise: On-chain data reflects long-term trends; short-term prices may deviate due to sentiment.

4. Case Study: Current Market
As of April 2025, Bitcoin’s MVRV-Z is 1.2, near historical averages, indicating neutral sentiment. A breakout above 2.5 could signal a new bull run, while a drop below 0.9 may present long-term entry points.
MVRV is a vital "thermometer" for Bitcoin investing, but never rely on it alone. Beginners should track data via platforms like Glassnode and CryptoQuant, integrating macroeconomic insights for optimal decisions.


No comments yet