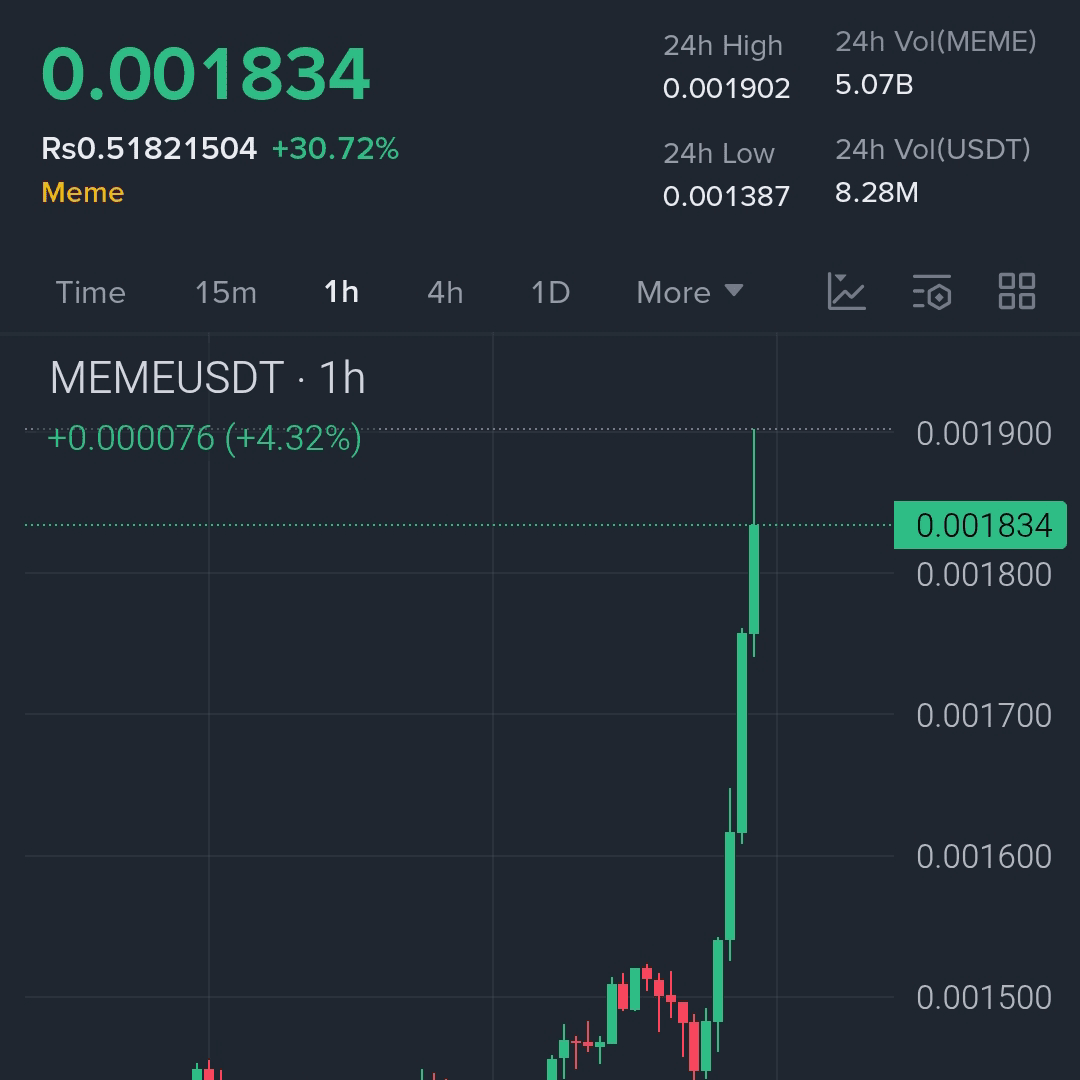
Let's start with the basics: Areas above swing highs and below swing lows are the most liquid areas of the market, where prices are most attractive. In recent days, we've seen Bitcoin hit new highs just above its previous all-time high (ATH).
This is an area of high liquidity.
What typically happens after a liquid area is broken?
The market experiences a temporary reversal.
Scalpers are well aware of this, as they see these swings play out daily.
Prices began to plummet.
Some attribute this to Trump's announcement of 100% tariffs on China. But the market is no stranger to such news.
Why did it react this way?
As always, news is only the tip of the iceberg when it comes to impulsive moves.
For an impulsive move to occur, it must first be based on a chart. In this case, we see a difficult and slow climb to a new all-time high, which likely leads to a buildup of orders.
This buildup of orders pushes the price into the liquidity pool above the previous ATH, completing the accumulation process that drives the price to the top.
Now that the liquidity from the previous swing highs has been absorbed, what's the next target liquidity area? All the swing lows that occurred during the accumulation phase. And not only that.
Why didn't price stop absorbing liquidity during the last accumulation phase, instead moving further lower?
Because the market structure has been stretched for so long, we haven't seen liquidity break below a significant low since June 22nd.
Thus, price ignored every internal structure, every internal FVG (Fast Wave Peak), and every minor swing low, collecting all remaining liquidity until it stopped at a key area.
This support area is the same as the liquidity absorption area from June 22nd. This area held the price above $100,000. This area acts as a psychological barrier. This area presents a significant FVG, which, once rebalanced, becomes support for the market structure.
What's next?
There are several possibilities, but we will analyze them in the following articles.


