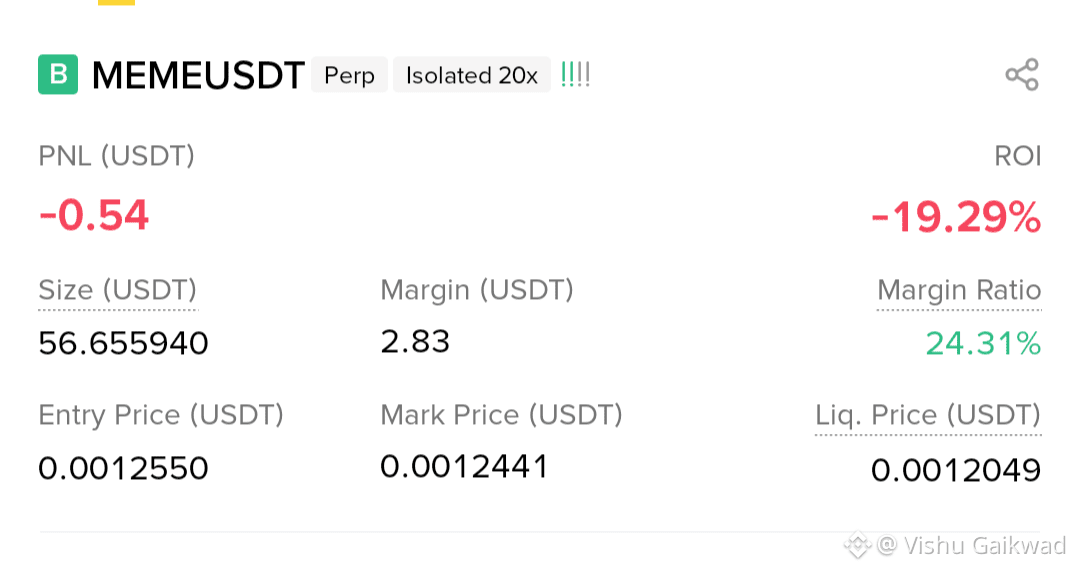
Event Review 🔍
Recently, Ethereum (ETH) has experienced dramatic fluctuations in a very short period of time. In just 15 minutes, the market price presented by different data sources quickly broke through from about $2492 to $2547, an increase of more than 2.20%. Then, during the local consolidation phase, the price hovered between $2525 and $2536, and finally fell back to about $2523.04. This series of fluctuations has aroused widespread market attention to macro policy expectations, whale capital dynamics, and technical overbought signals. At the same time, the market has continuously reported positive and negative news about stablecoin regulations, ETF audits, and institutional capital flows, exacerbating the volatility of market sentiment.
Timeline 📅
00:55
• Market volatility: Some channels show that ETH is quoted at about $2492, and another channel is about $2525. At the same time, the daily chart turns green, suggesting that the upward signal is beginning to appear.
00:55 to 01:10
• ETH price climbed rapidly: In just 15 minutes, the price soared from about $2492 to $2547, an increase of nearly 2.20%, indicating that a large amount of funds suddenly intervened.
01:03
• Liquidity pressure exposed: Fluid DEX's ETH-USDC trading pool suffered huge losses from liquidity providers, revealing signs that whale funds used hidden split orders, and market liquidity was partially impacted.
01:04
• Breaking through key psychological prices: ETH prices successfully broke through the $2,500 mark, further strengthening the market's bullish sentiment.
00:55 to 01:22
• Local consolidation stage: Another data statistic shows that the price rose slightly from $2525 to $2536 (an increase of only about 0.45%), indicating that after the sharp rise, the power of buyers and sellers tended to balance.
01:38
• Rapid pullback: ETH price adjusted and fell back to about $2523.04, short-term fluctuations tended to end, and the market entered a consolidation phase.
Reason analysis 🤔
The sharp fluctuations in the ETH market this time were mainly affected by the following two factors:
Macroeconomic and policy expectations
The upcoming CPI data in the United States, the market's expectations for the Fed's future interest rate cut cycle, and recent news about stablecoin regulations and institutional products (such as Bitcoin ETFs and custody services) have jointly affected market expectations. The uncertain policy environment has prompted investors to react violently during the process of fund adjustment, accelerating the rapid rise and pullback of prices.
Whale fund dynamics and market micro-operations
On-chain data shows that multiple large orders of tens of millions of dollars have continued to appear in a short period of time, especially the explosion order statistics show that the total value of orders on the entire network in the past hour reached 10 million US dollars, of which short orders accounted for as high as 90%. At the same time, the net inflow of large transactions was about 40 million US dollars. These data reflect that whale funds are constantly switching between chasing highs and selling pressure, accelerating the sharp fluctuations in market prices.
Technical Analysis 📊
This technical analysis is based on the 45-minute K-line data of Binance USDT perpetual contract, and is carried out for the ETH/USDT trading pair. The main technical indicators are as follows:
Bollinger Bands and Moving Average Trends
The price continues to run along the upper track of the Bollinger Bands, showing a strong upward trend. In the short term, MA5, MA10, and MA20 are all in a bullish arrangement, indicating that the market is bullish. The price is also above the EMA5/10/20/50/120 moving averages, but the position close to the upper track suggests that it is currently in the overbought area.
KDJ indicator signal
Although three consecutive positive lines have formed a red three-soldier pattern, showing a strong bullish signal, the KDJ indicator has a dead cross and is in an overbought state, which may indicate a technical correction risk in the short term.
Volume and OBV indicators
The trading volume has increased by 27.68% and 36.13% respectively compared with the short-term moving average (10-day moving average), indicating that the market activity has increased significantly. At the same time, the OBV line broke through the previous high, indicating that the buyer's power is continuing to exert force, but the energy accumulation after the high-speed rise may also lead to short-term profit-taking.
MACD momentum observation
The MACD histogram has continued to grow, supporting the current upward momentum. However, the indicator also shows that the trend is divergent. There is a certain difference in the technical aspect between chasing high funds and gradually locking in profits.
Outlook for the future 🚀
Looking forward, ETH may still fluctuate and consolidate in the high area in the short term. Although the market is affected by multiple policies and macroeconomic factors, overall, the bulls are still relatively strong. The following points need to be paid attention to:
Adjustment risk and profit-taking
The current technical indicators show overbought risks, and the dead cross of KDJ indicates that there may be a short-term correction. Investors should pay close attention to whether the price can stand firmly above the key moving average.
Macro policy dynamics
Affected by the impact of the upcoming CPI data and the expected policy of the Federal Reserve, the market may continue to fluctuate. In the next few days, the release of policies and macro data will play a key role in market trends.
Whale Operations and Liquidity Management
The bizarre operations of whale funds and the frequent appearance of large orders indicate that there is a competition of capital games in the market. If market sentiment turns cautious, some institutions and whales may choose to gradually lock in profits, triggering price adjustments.
Long-term trend vs. short-term volatility
In the medium and long term, ETH has solid fundamental support, and the current sharp fluctuations are more due to technical adjustments and market sentiment fluctuations. For long-term investors, it may still be a good strategy to layout on dips, but short-term volatility traders need to remain highly vigilant, control positions, and avoid chasing high risks.
Overall, the current price fluctuations of ETH reflect the complex game of the market under the dual effects of macro factors and micro-operations of funds. Investors need to pay attention to policies and economic data while closely tracking changes in technical indicators to better grasp risks and opportunities.