$MEME E/USDT Short-Term Technical Analysis: Short-Term Trading Signals
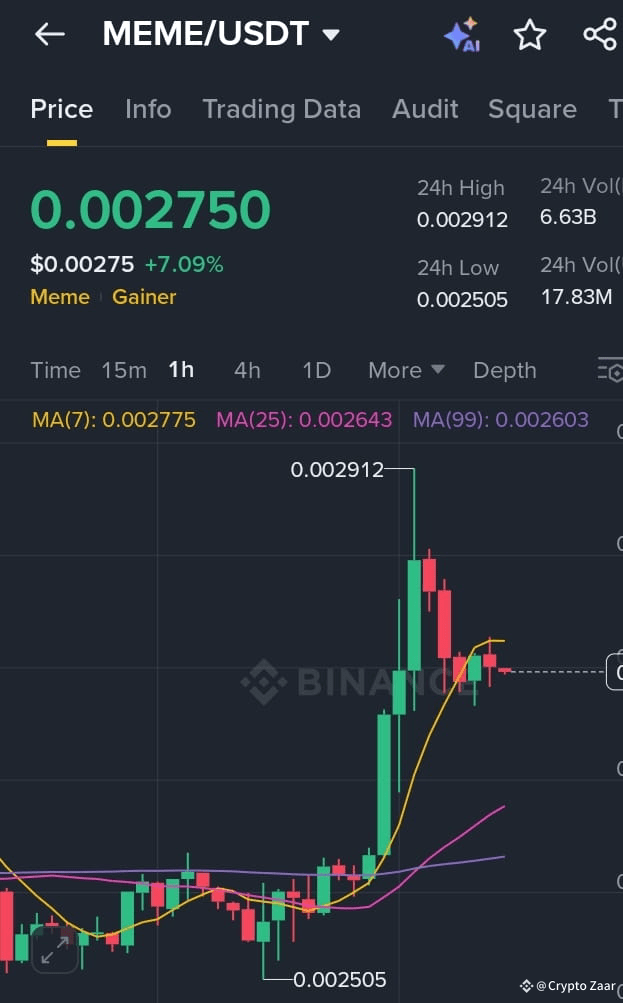
According to the 1-hour candlestick chart of MEME (Memecoin) on Binance, the price action suggests that further declines are possible in the short term.
Current Price: $0.001740
Moving Average Analysis (MA Crossover):
* The short-term trend is bearish as the price is currently below the 7-day moving average (MA) at $0.001760.
* The 7-day MA (yellow) is crossing or about to cross the 25-day MA (pink) and the 99-day MA (purple), which is a typical bearish signal (MA Crossover).
* The 25-day MA and the 99-day MA are very close, indicating a narrow consolidation phase after the sharp drop from the recent high of $0.001833.
* The latest red candlestick closed below the moving average (7), confirming the presence of selling pressure in the short term.
Market Short-Term Outlook:
Market structure on the hourly chart shows that the recent swing high has been broken and is showing clear downward momentum. The price continues to form lower highs and is currently testing the moving average support level. If it breaks, it may quickly fall to the 24-hour low. A decisive break below the moving average (99) will confirm the continuation of the strong bearish trend in this time frame.
Trade Setup: Short-Term Entry
* Entry Point: Enter the market on a clear break below the current moving average, ideally below the moving average (99) at $0.001737. A safe entry point may be around $0.001735.
* Target 1: Recent 24-hour low of $0.001672.
* TP 2: Below the psychological level of the 24-hour low, for example, $0.001650.
* SL (Stop Loss): Place the stop loss above the short-term moving average resistance level, for example, $0.001780 (above the MA(7) and the body of the last major bullish candle).
$MEME
#MEME #CryptocurrencyTrading #TechnicalAnalysis #Binance #Short-TermSignals