📊 $ACT / USDT 12-Hour Chart Analysis 🔥
$ACT quietly gains momentum while the market is dormant! 👀
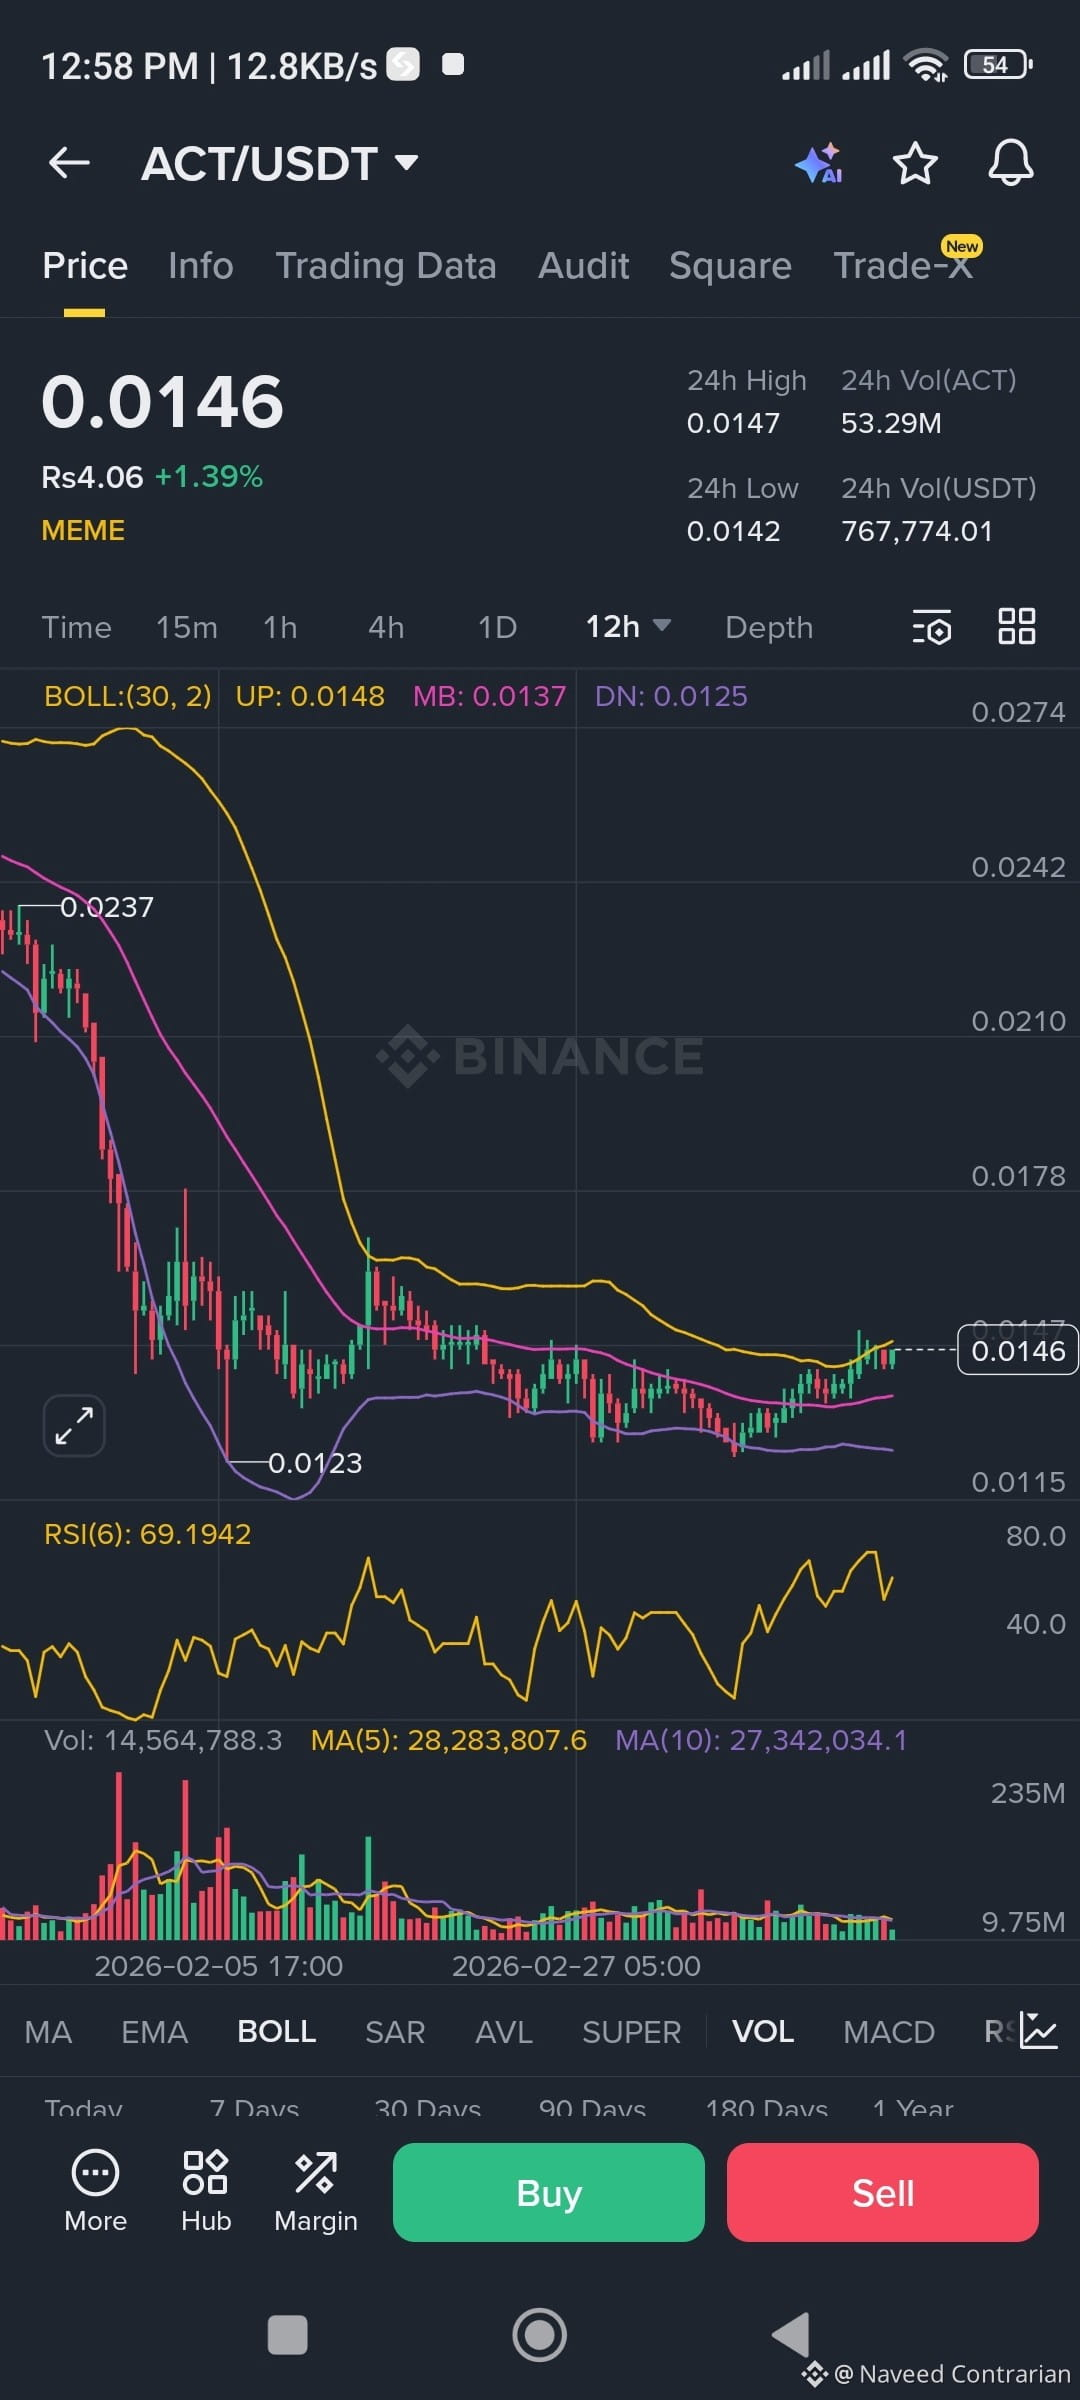
After a significant pullback from $0.0237 to $0.0123, ACT has found strong support and is currently back at $0.0146, breaking through the Bollinger Band middle line ($0.0137), a classic bullish reversal.
📊 Key Signals:
🟢 RSI(6) is at 69.19, momentum is building, not yet overheated
🟢 Price has returned to the Bollinger Band middle line, bulls are in control
🟡 Volume is below the moving average, in an accumulation phase, a significant upward move is imminent
The previous decline was triggered by overall market pressure on Bitcoin's dominance, but ACT is now quietly surpassing Bitcoin with a strong rebound.
Smart investors don't announce entry points publicly. This kind of chart is more persuasive than any news report.
Please study it yourself. The chart says it all. 📈
#ACT #MEME #Binance #CryptoGems #AImeme

Price Converter

- Crypto
- Fiat
USDUnited States Dollar

CNYChinese Yuan
JPYJapanese Yen
HKDHong Kong Dollar
THBThai Baht
GBPBritish Pound
EUREuro
AUDAustralian Dollar
TWDNew Taiwan Dollar
KRWSouth Korean Won
PHPPhilippine Peso
AEDUAE Dirham
CADCanadian Dollar
MYRMalaysian Ringgit
MOPMacanese Pataca
NZDNew Zealand Dollar
CHFSwiss Franc
CZKCzech Koruna
DKKDanish Krone
IDRIndonesian Rupiah
LKRSri Lankan Rupee
NOKNorwegian Krone
QARQatari Riyal
RUBRussian Ruble
SGDSingapore Dollar
SEKSwedish Krona
VNDVietnamese Dong
ZARSouth African Rand
No more data