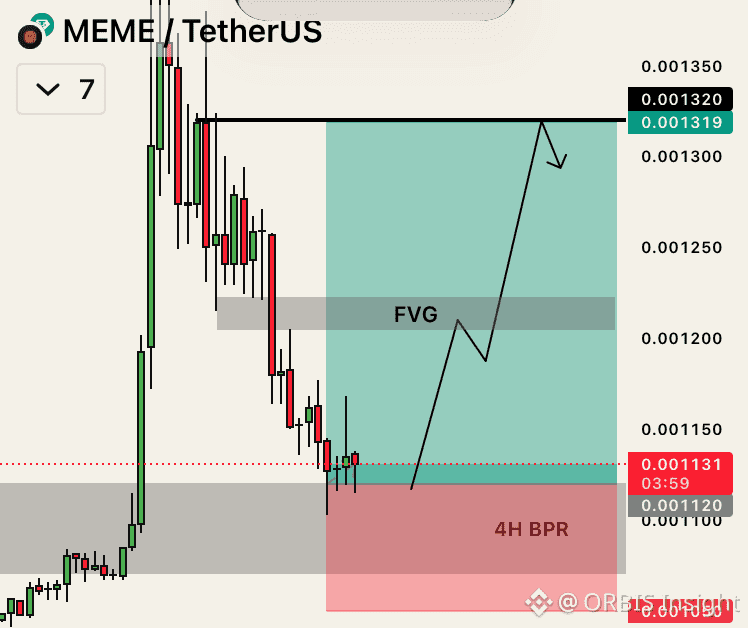
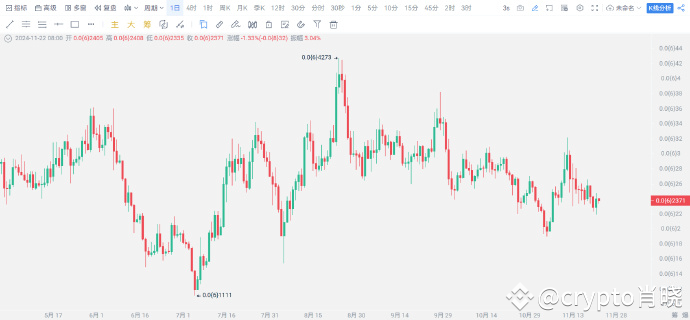
🚨 $MEME $30 Million Ultra-Short-Term Trading Alert! 🚨
A strong rebound from the 4-hour BPR zone has been confirmed. A high-probability upward move is brewing. It's time to act!
Entry Point: Market Price 📉
Target Price: 0.00120 - 0.00132 🚀
Stop Loss: 0.00105 🛑
We're going to conduct a fast, ultra-short-term trade. Don't miss this move in $MEME. Enter now!
#CryptocurrencyTrading #Altcoins #UltraShortTermTrading #MEME 💸
{future}(MEMEUSDT)
Price Converter
- Crypto
- Fiat
USDUnited States Dollar
CNYChinese Yuan
JPYJapanese Yen
HKDHong Kong Dollar
THBThai Baht
GBPBritish Pound
EUREuro
AUDAustralian Dollar
TWDNew Taiwan Dollar
KRWSouth Korean Won
PHPPhilippine Peso
AEDUAE Dirham
CADCanadian Dollar
MYRMalaysian Ringgit
MOPMacanese Pataca
NZDNew Zealand Dollar
CHFSwiss Franc
CZKCzech Koruna
DKKDanish Krone
IDRIndonesian Rupiah
LKRSri Lankan Rupee
NOKNorwegian Krone
QARQatari Riyal
RUBRussian Ruble
SGDSingapore Dollar
SEKSwedish Krona
VNDVietnamese Dong
ZARSouth African Rand
No more data


