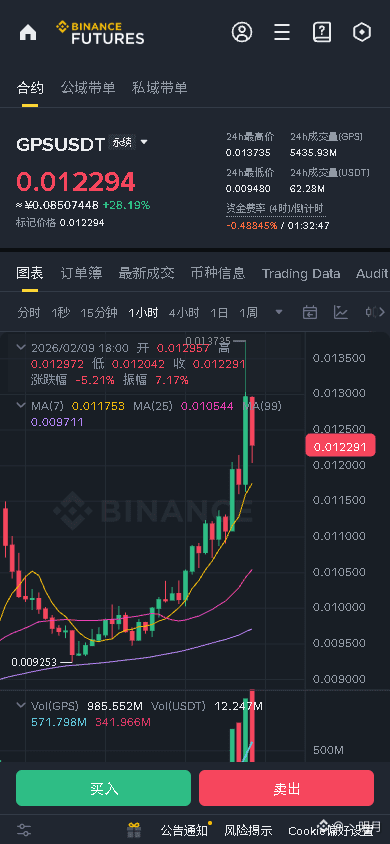
After a violent 30% surge, $GPS showed clear signs of distribution at its high level. Price and open interest (OI) diverged, with taker selling dominating – a typical short-covering + major player distribution structure.
🎯Direction: Short
🎯Entry: 0.01245 - 0.01255
🛑Stop Loss: 0.01300 (Rigid Stop Loss)
🚀Target 1: 0.01120
🚀Target 2: 0.01000 The 4-hour chart shows three consecutive high-volume bullish candles completing the rally, but the buy/sell ratio on the last candle has dropped to an equilibrium point of 0.5, indicating exhausted buying pressure at higher prices. Key data: 1) The OI leveled off when prices hit new highs, indicating the rise was driven by short covering rather than new long openings; 2) A deep negative funding rate (-0.5%) exposes a large amount of unstable long leverage, which could easily trigger a sell-off; 3) A huge accumulation of sell orders (Asks) above 0.01251 forms a clear supply zone. Logically, this is a "long trap" after a "short sell-off," with major players distributing their holdings at high liquidity levels.
Trade here 👇 $GPS
{future}(GPSUSDT)
--- Follow me for more real-time crypto market analysis and insights!
#Plasma #AVE #MEME
@BinanceSquareCN
$ETH
{future}(ETHUSDT)
{future}(BTCUSDT)