They laughed it off, but the $MEME chart is sending real warning signs ⚠️
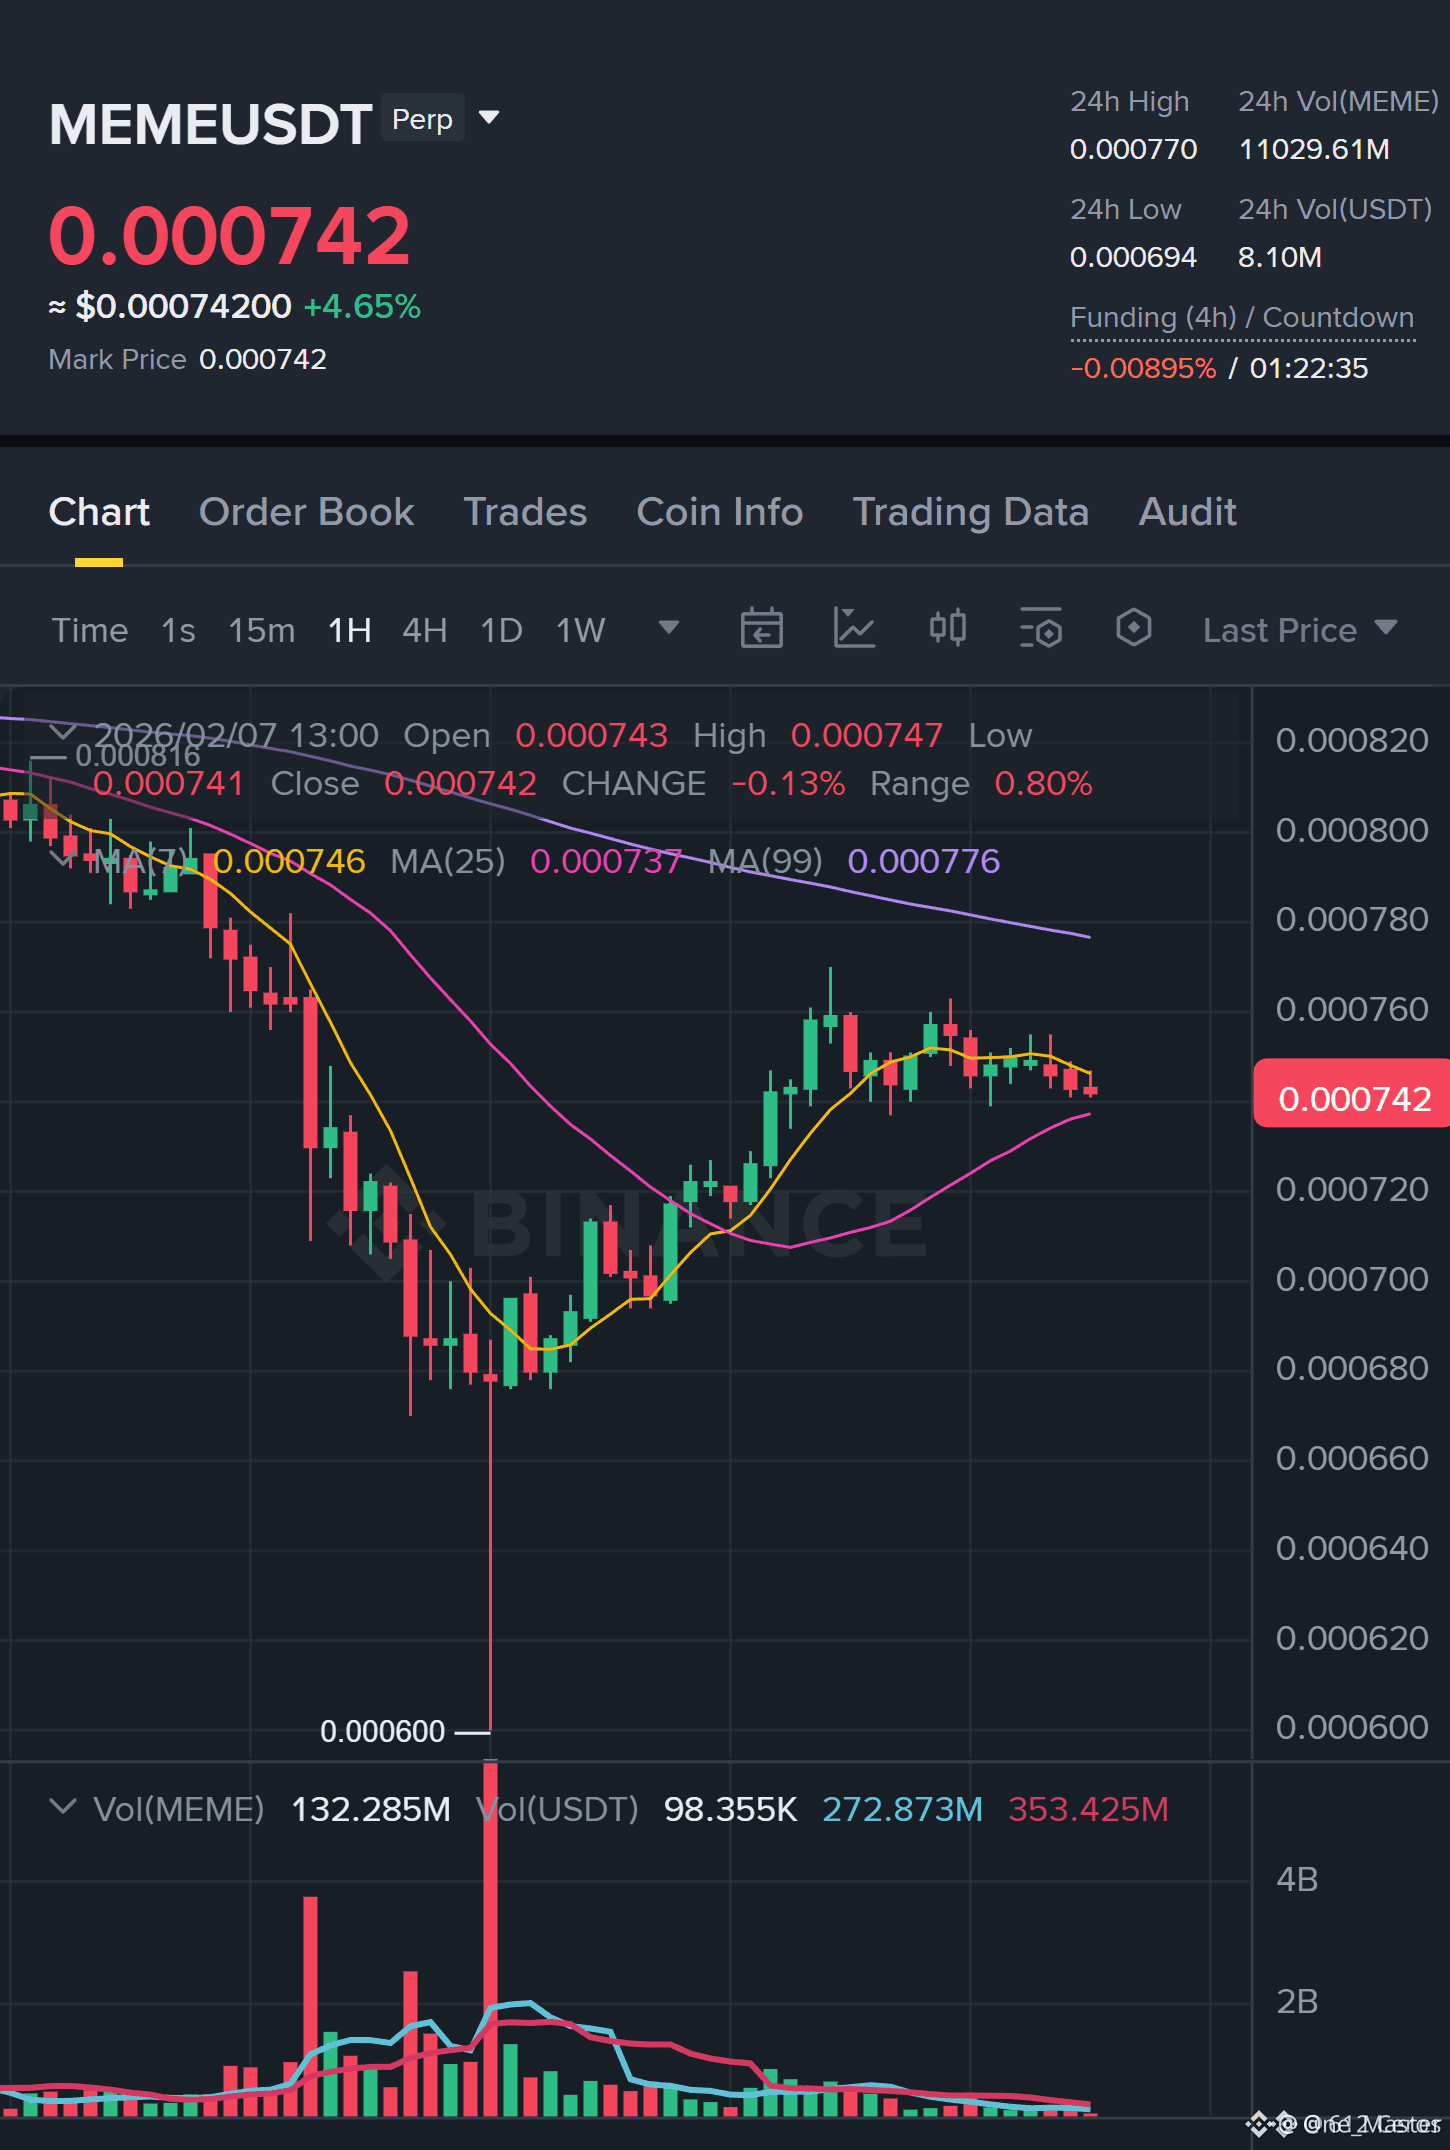
$MEME/USDT — Short Setup
Trading Plan
Entry Point: 0.000739 – 0.000746
Stop Loss Point: 0.000764
TP1: 0.000722
TP2: 0.000715
TP3: 0.000701
🤷Why this setup works
The daily chart structure remains strongly bearish.
Low timeframe RSI does not show an oversold bounce → Sellers still dominate.
The 4-hour chart is poised to point to 0.000722.
Every rally so far has appeared to be a corrective bounce, not an impulsive one.
💫Market Discussion: Is this just the last consolidation before a sudden surge similar to the meme-style rally…?
Or will the price relentlessly pound TP2 and TP3?
Professional Tips
Take profits gradually at TP1, using a trailing stop-loss order to lock in profits until break-even.
If the price breaks below the stop-loss, immediately abandon the strategy.
Avoid chasing highs and lows – let the price move into your target area.
Memecoin prices fluctuate rapidly: discipline is more important than speculation.
Stand: Remain bearish until there is evidence to support the opposite view.
Risk management is key – you are trading opportunities, not speculation.
👉 Click here to trade
{future}(MEMEUSDT)
#MEME #Memecoins🤑🤑 #MarketRally #WhenWillBTCRebound #ADPDataDisappoints