MEME/USDT Alert: Is the Rally Weakening?
The MEME/USDT pair experienced significant volatility today, but technical indicators on the 15-minute chart suggest a potential price reversal. After a strong rally, the market is showing signs of fatigue.
🔍 Key Technical Analysis:
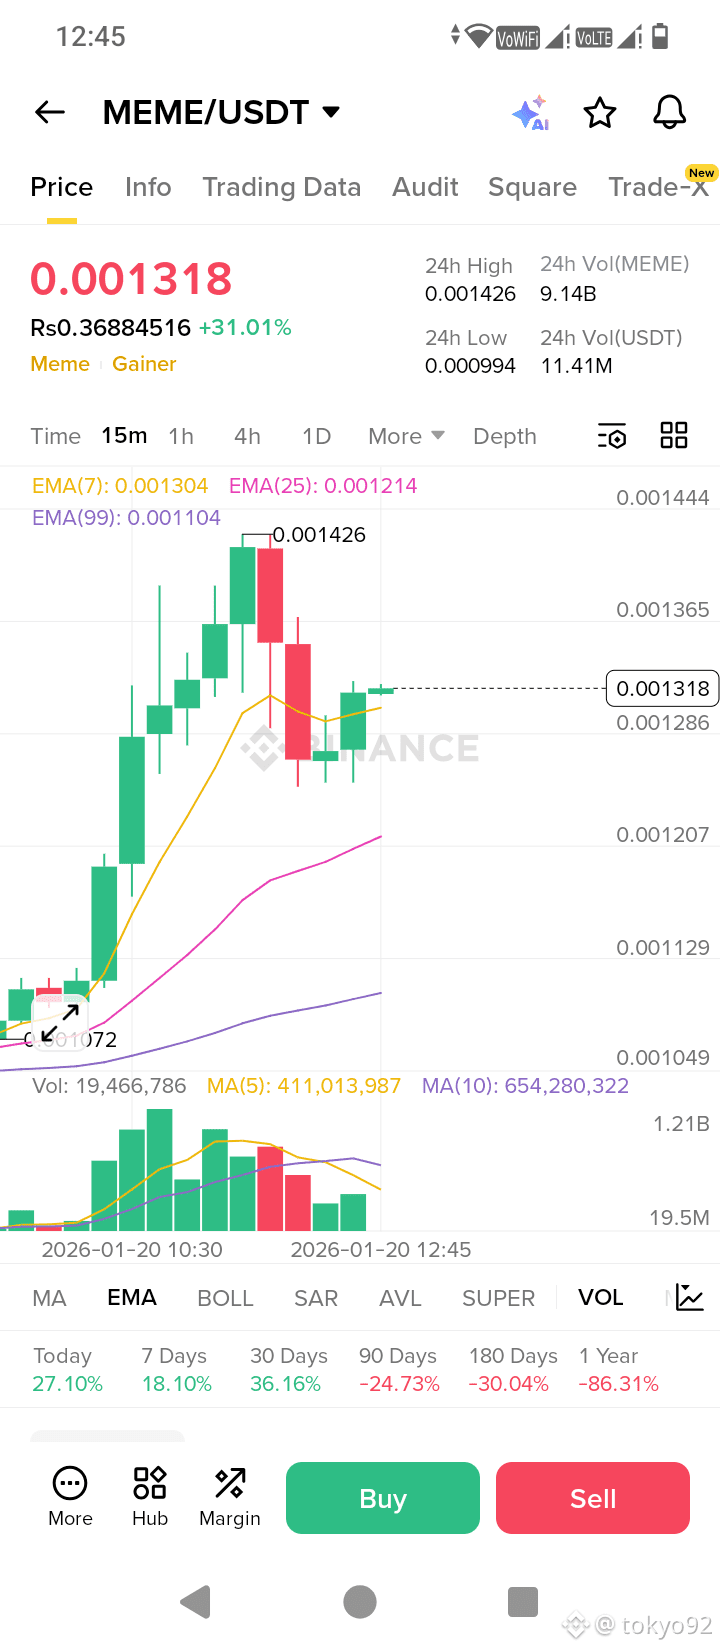
Resistance Pullback: The price immediately retreated after hitting a high of 0.001426. The consecutive red candlesticks indicate that sellers are taking profits at higher levels.
Price Movement: Short-term charts show "lower highs." This typically indicates weakening upward momentum and a higher probability of a pullback.
Support Levels to Watch: If the price fails to hold the 7-week moving average (EMA) (0.001304), the next potential downside target will be the 25-week moving average (EMA) (0.001214).
Volume Analysis: Trading volume has begun to decrease compared to the initial surge, which usually foreshadows a price decline or consolidation phase.
⚠️ Trader's Note:
While the daily chart still shows a positive trend (+31%), the short-term trend is turning bearish. Avoid chasing the price higher at current levels. If you hold long positions, consider tightening your stop-loss or locking in some profits.
#MEME $MEME #WriteToEarnUpgrade #Square #USJobsData #BTC100kNext? $BTC
{spot}(BTCUSDT)
$BNB